Adding text with geom_text() or
geom_label()

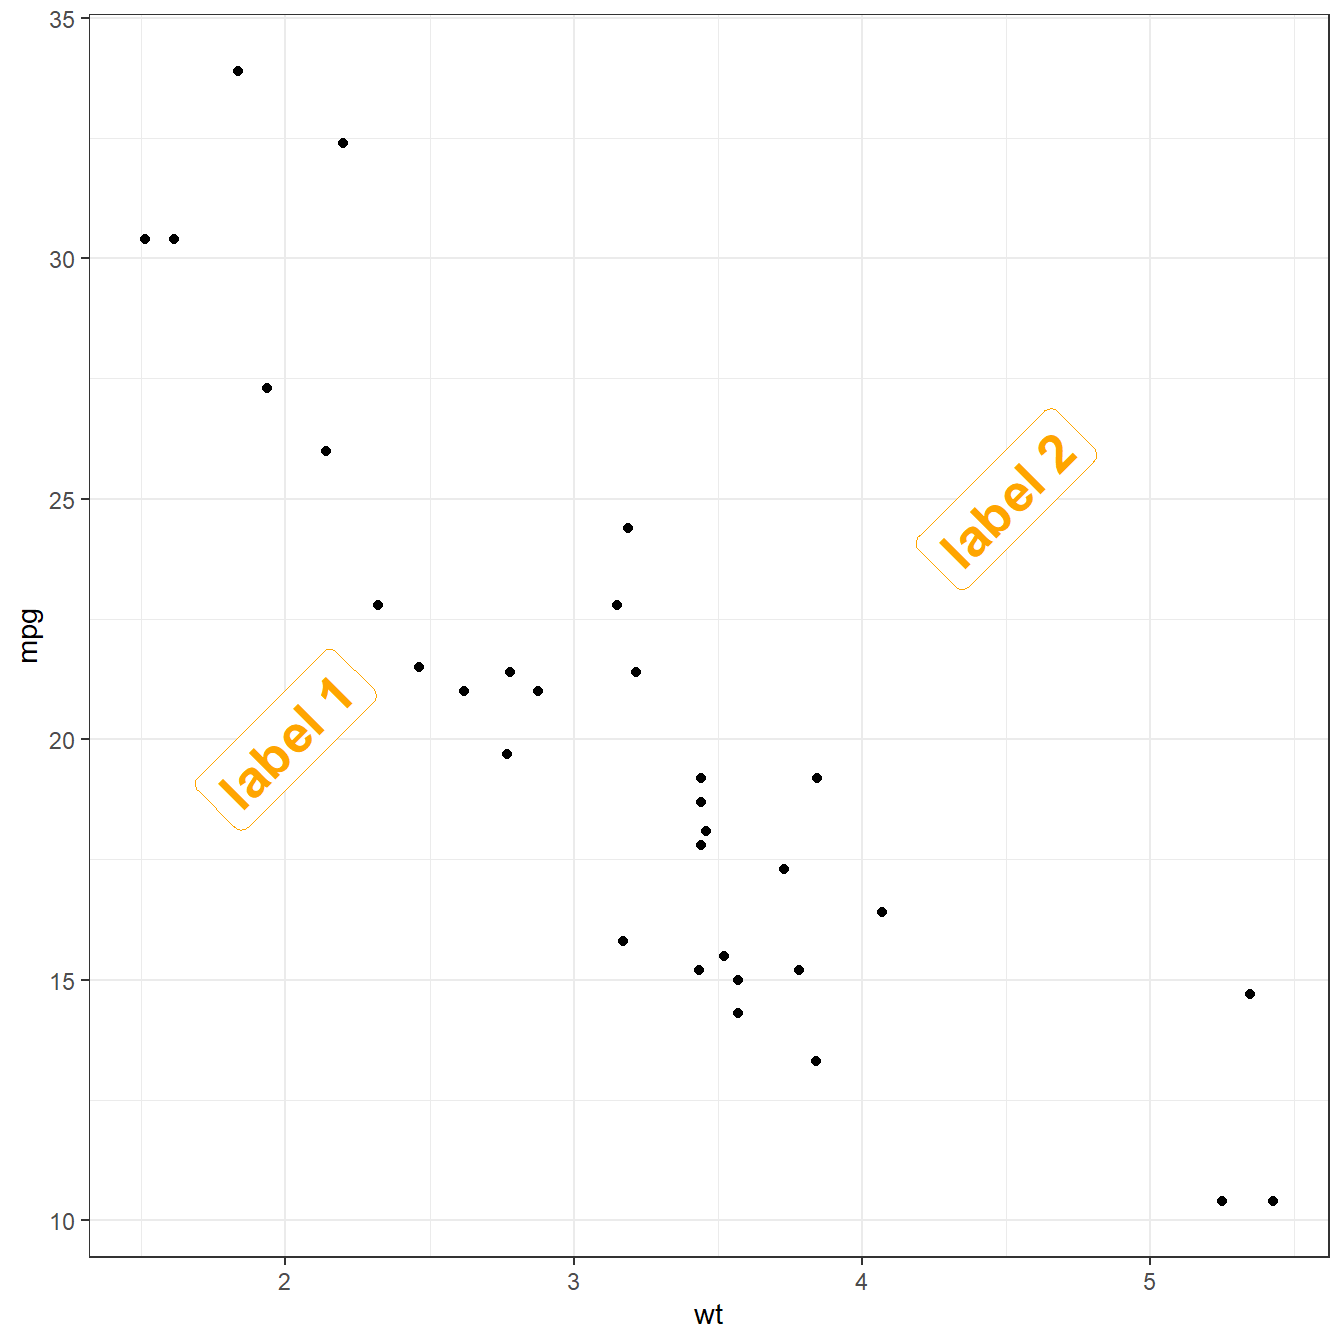
Text is the most common kind of annotation. It allows to give more information on the most important part of the chart.
Using ggplot2, 2 main functions are available for that
kind of annotation:
geom_textto add a simple piece of textgeom_labelto add a label: framed text
Note that the annotate() function is a good alternative
that can reduces the code length for simple cases.
Add shapes with annotate()
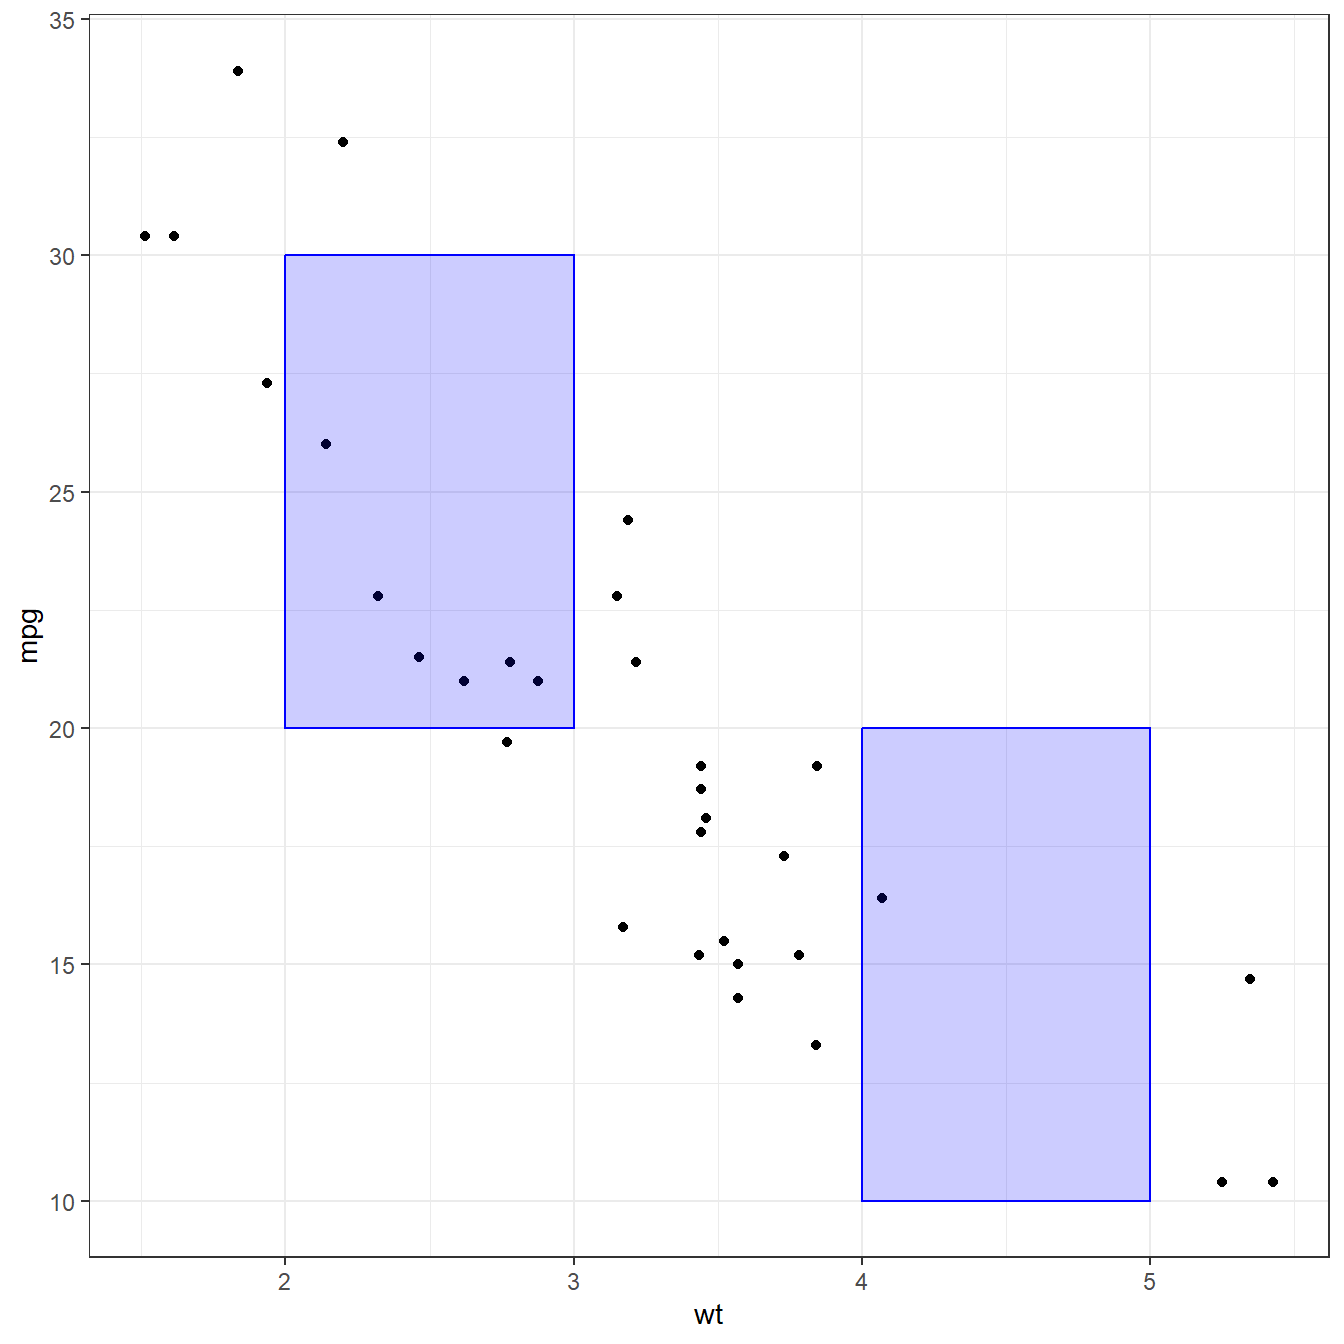
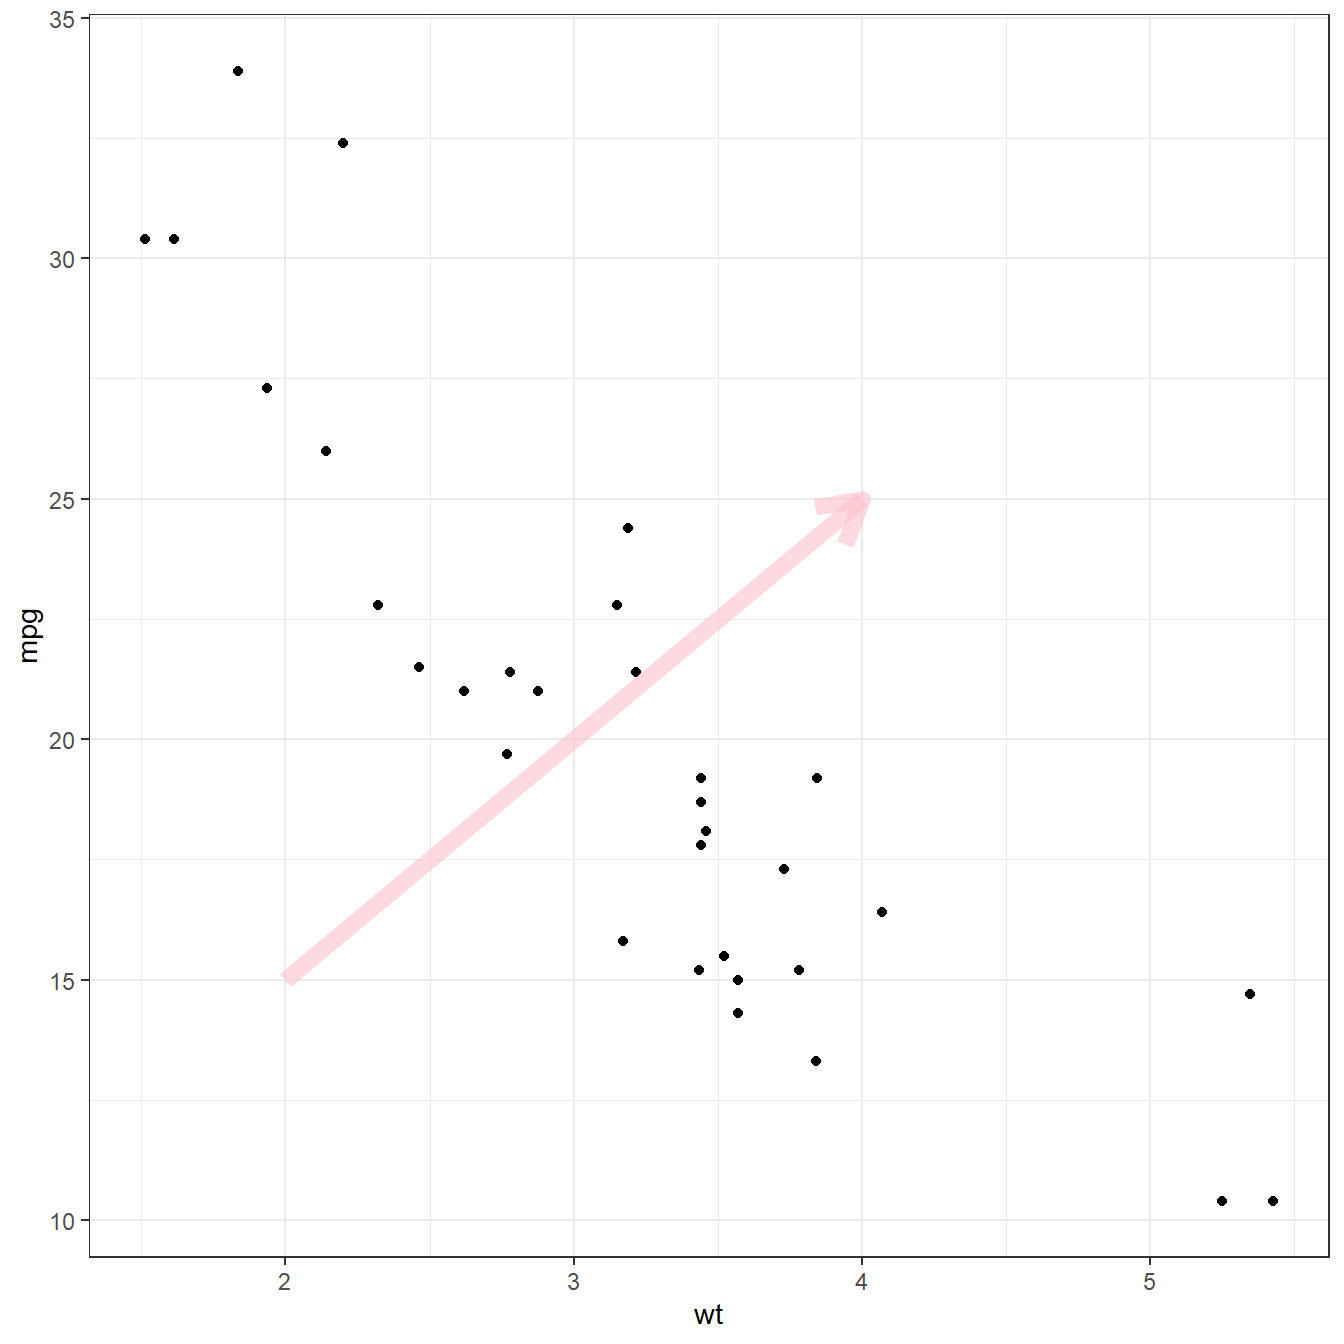
The annotate() function allows to add all kind of shape
on a ggplot2 chart. The first argument will control what
kind is used: rect or segment for rectangle,
segment or arrow.
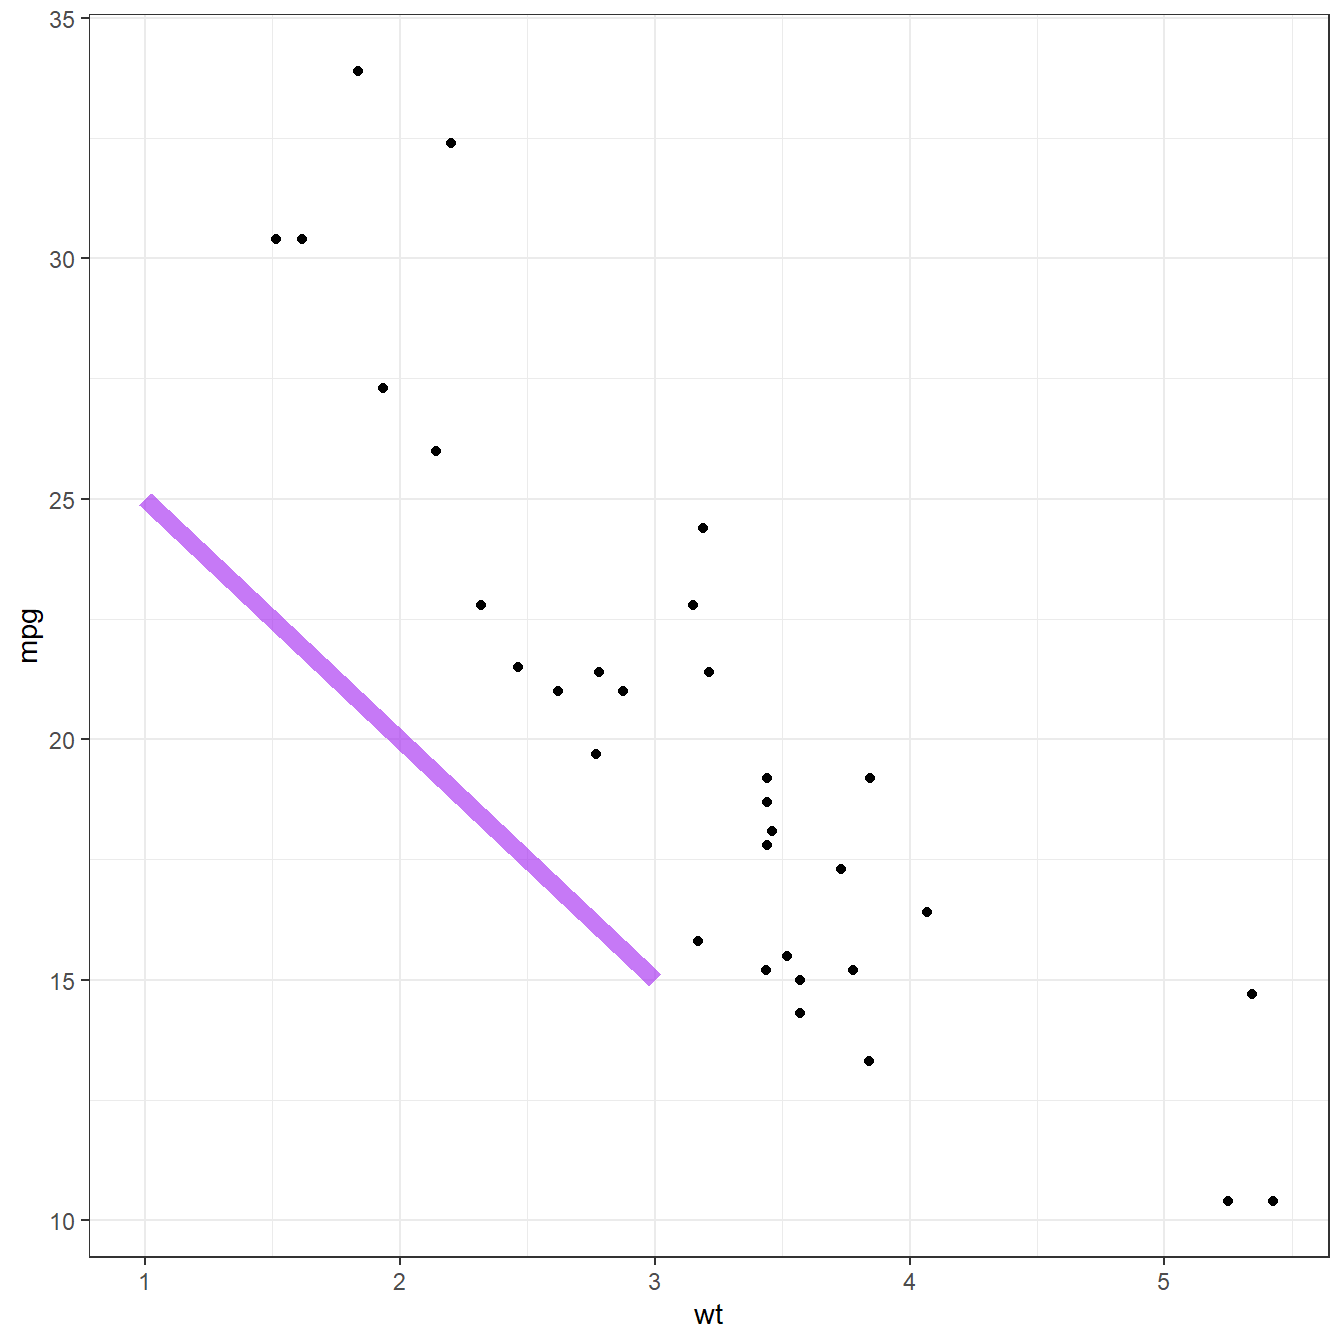
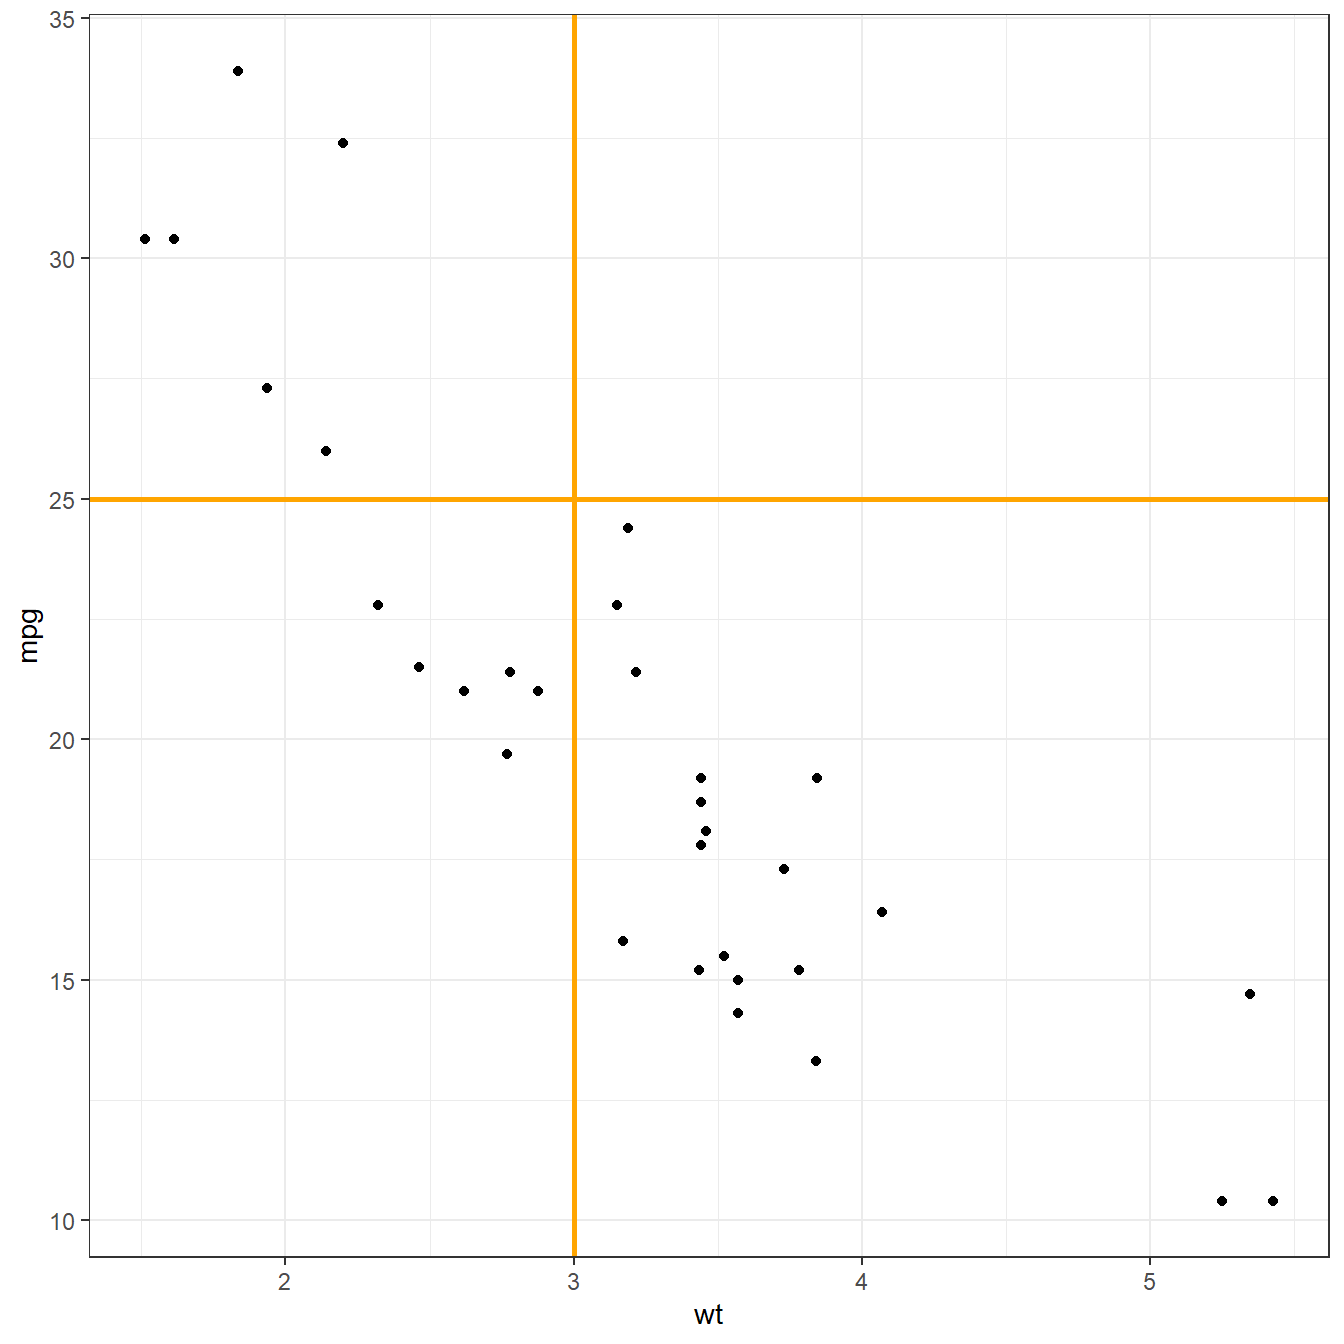
Add ablines with geom_hline() and
geom_vline()
An abline is a segment that goes from one chart extremity to the
other. ggplot2 offers the geom_hline() and
geom_vline() functions that are dedicated to it.
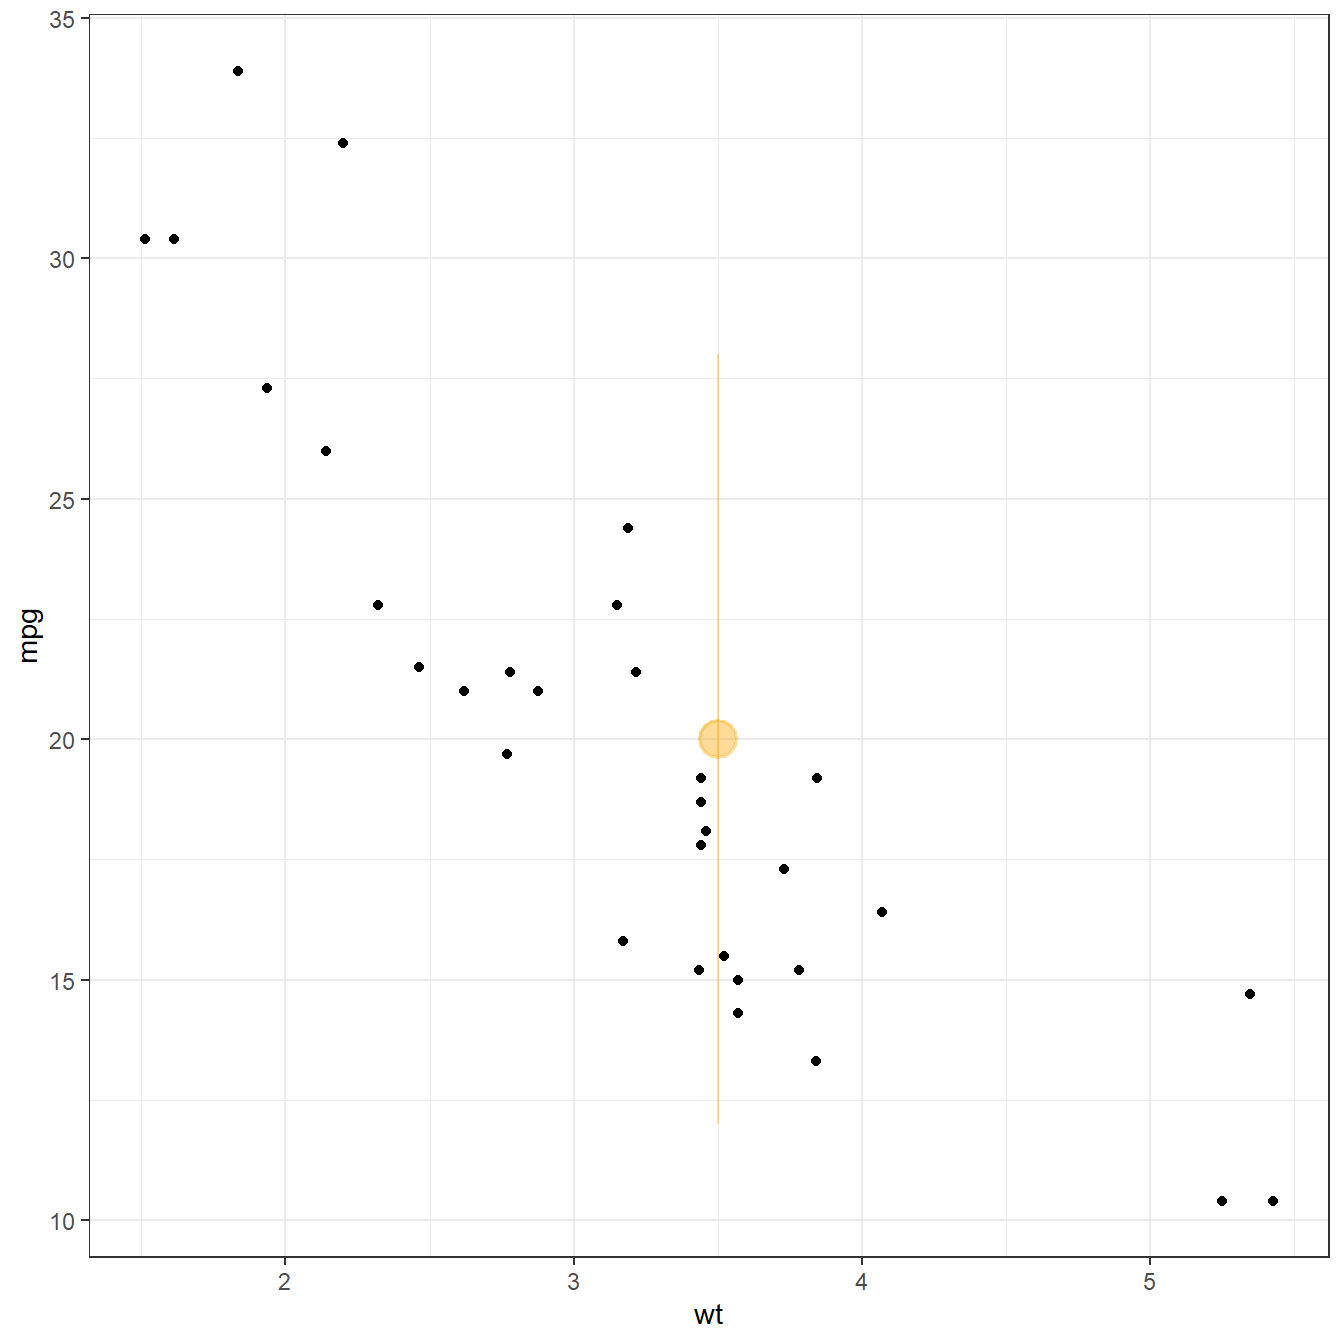
Add a point and a range with.. pointrange()
Last kind of annotation, add a dot and a segment directly with
pointrange().