Modeling

Forest Plot

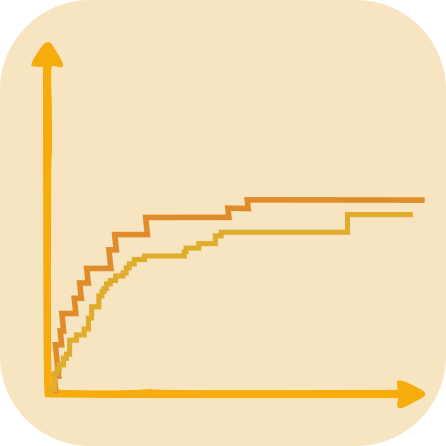
ROC Curve
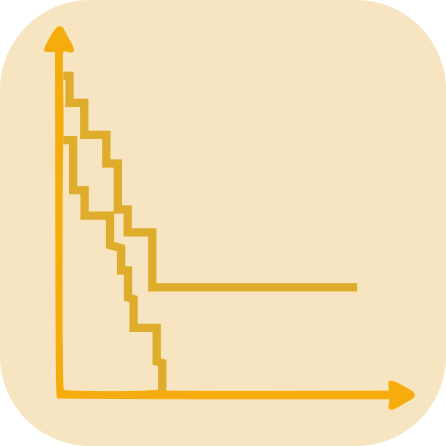
Survival Curve
Competing Risks Curve
Love Plot
Visualisation

Swimmer Plot

Waterfall Plot

Spaghetti Plot

Spider Plot

Adverse Event

Likert Plot

Parallel Coordinate Plot

Sankey Diagram

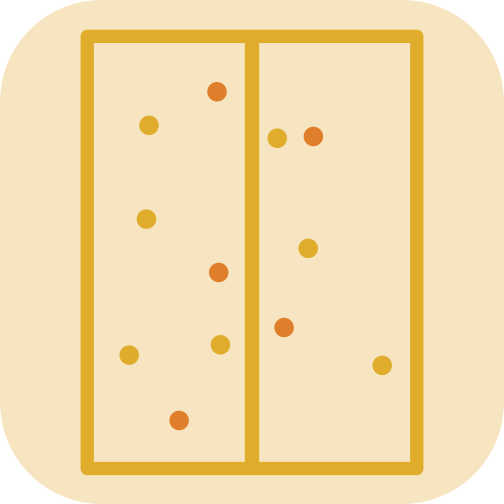
Missing Data
Basic ggplot charts

Barplot

Boxplot
Histogram

Density
Dots
Dose finding

DLT Plot

Escalier Plot

Piscine Plot
General knowledge
Ggplot2

Ggplot
Cheat Sheet
Cheat Sheet

Color Palettes
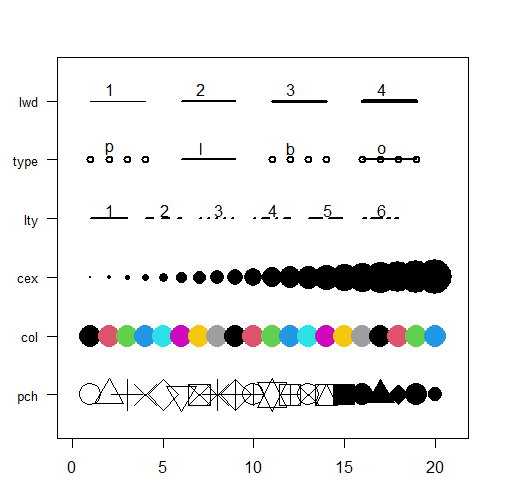
Graph Parameters Cheat Sheet
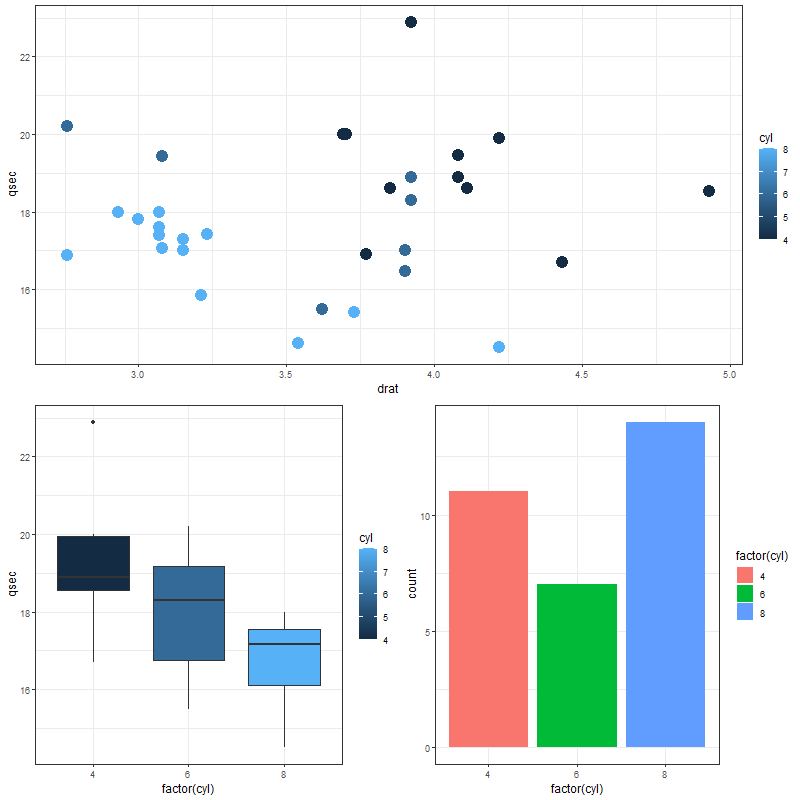
Mixing Charts