Data
We use the R dataset lung in the survival
package. We can select variables and change their names using the
transmute() function, or add labels to our variables of
interest using the apply_labels function:
# Libraries
library(survival)
library(dplyr)
library(expss) # for apply_labels function
library(forestmodel)

# Data
pretty_lung <- lung %>%
  transmute(time,
    status = status - 1,
    age,
    sex = factor(sex, labels = c("Male", "Female")),
    ph.ecog = factor(ph.ecog),
    meal.cal) %>%
  apply_labels(
    age = "Age",
    sex = "Sex",
    ph.ecog = "ECOG",
    meal.cal = "Meal Cal")
pretty_lung format:
A data frame with 228 observations on the following 6 variables:
time Survival time in days
status
Censoring status 0=censored, 1=dead
age Age in years
sex Patient sex
ph.ecog ECOG
performance score. 0=asymptomatic, 1= symptomatic but completely
ambulatory, 2= in bed <50% of the day, 3= in bed > 50% of the day
but not bedbound, 4 = bedbound
meal.cal Calories
consumed at meals
| time | status | age | sex | ph.ecog | meal.cal |
|---|---|---|---|---|---|
| 306 | 1 | 74 | Male | 1 | 1175 |
| 455 | 1 | 68 | Male | 0 | 1225 |
| 1010 | 0 | 56 | Male | 0 | NA |
| 210 | 1 | 57 | Male | 1 | 1150 |
| 883 | 1 | 60 | Male | 0 | NA |
| 1022 | 0 | 74 | Male | 1 | 513 |
| 310 | 1 | 68 | Female | 2 | 384 |
| 361 | 1 | 71 | Female | 2 | 538 |
forestmodel package
The forest_model function produce a forest plot based on
a regression model.
forest_model(
model,
regression model produced by lm,
glm, coxph
panels = default_forest_panels(model, factor_separate_line = factor_separate_line),
list with details of the panels
covariates = NULL, a
character vector optionally listing the variables to include in the plot
exponentiate = NULL, whether the numbers on the x
scale should be exponentiated for plotting
funcs = NULL, optional list of functions required for
formatting panels$display
factor_separate_line = FALSE, whether to show the factor
variable name on a separate line
format_options = forest_model_format_options(), formatting
options as a list as generated by
forest_model_format_options
theme = theme_forest(), theme to apply to the plot
limits = NULL, limits of the forest plot on the X-axis
breaks = NULL, breaks to appear on the X-axis
return_data = FALSE, return the data to produce the plot as
well as the plot itself
recalculate_width = TRUE,
TRUE to recalculate panel widths using the current
device or the desired plot width in inches
recalculate_height = TRUE, TRUE to
shrink text size using the current device or the desired plot height in
inches
model_list = NULL, list of models to
incorporate into a single forest plot
merge_models = FALSE, if TRUE, merge
all models in one section
exclude_infinite_cis = TRUE,
whether to exclude points and confidence intervals that go to positive
or negative infinity from plotting
...
)
Multivariate - Forest plot based on a logistic model
model <- glm(status ~ age + sex + ph.ecog + meal.cal, data=pretty_lung)
class(model) <- c("myglm",class(model)) # to use by default Wald CI
confint.myglm <- confint.default

print(forest_model(model))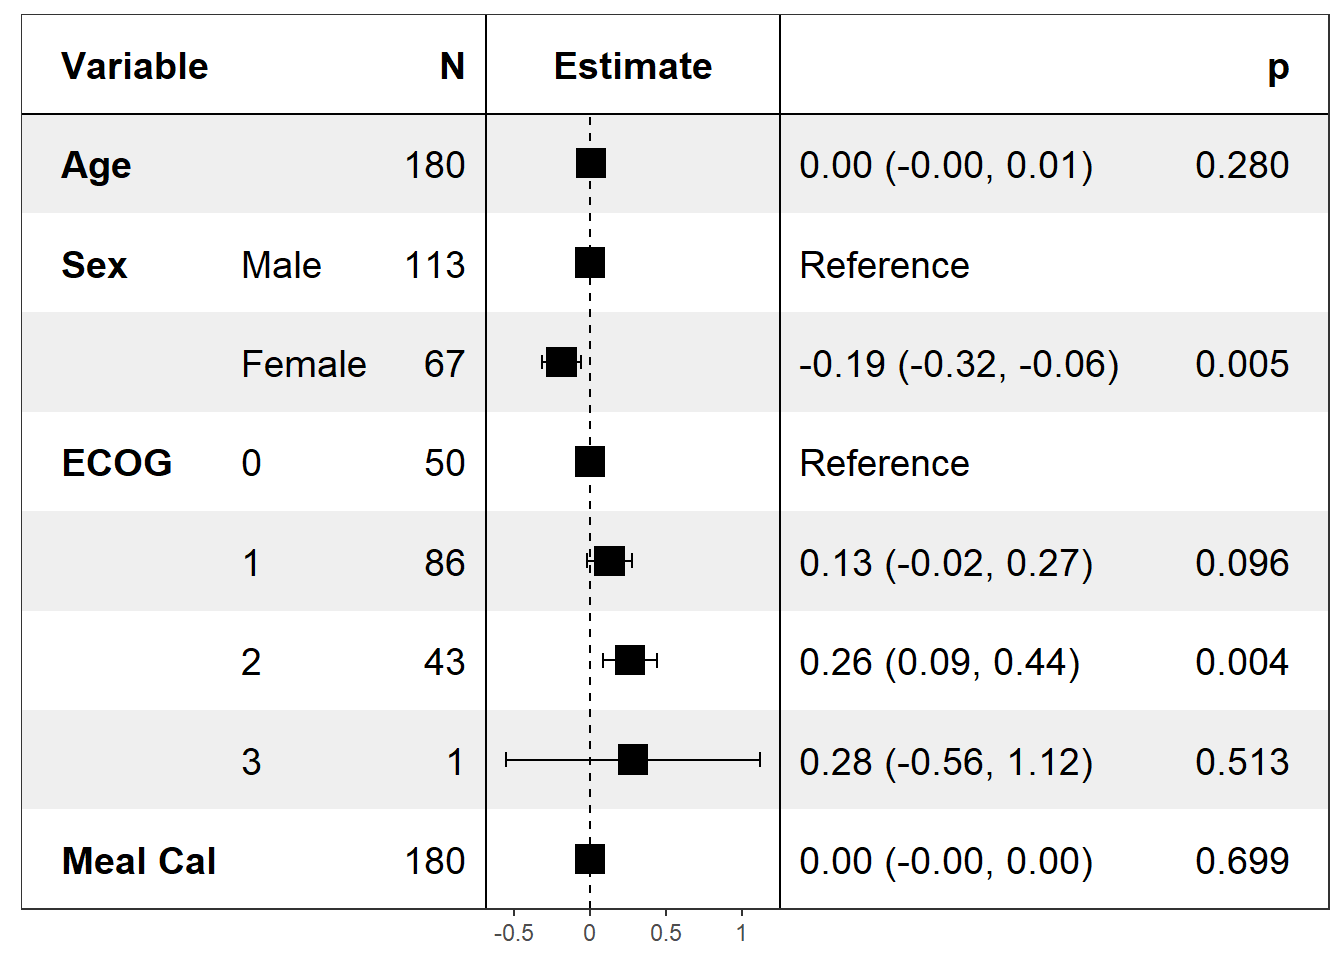
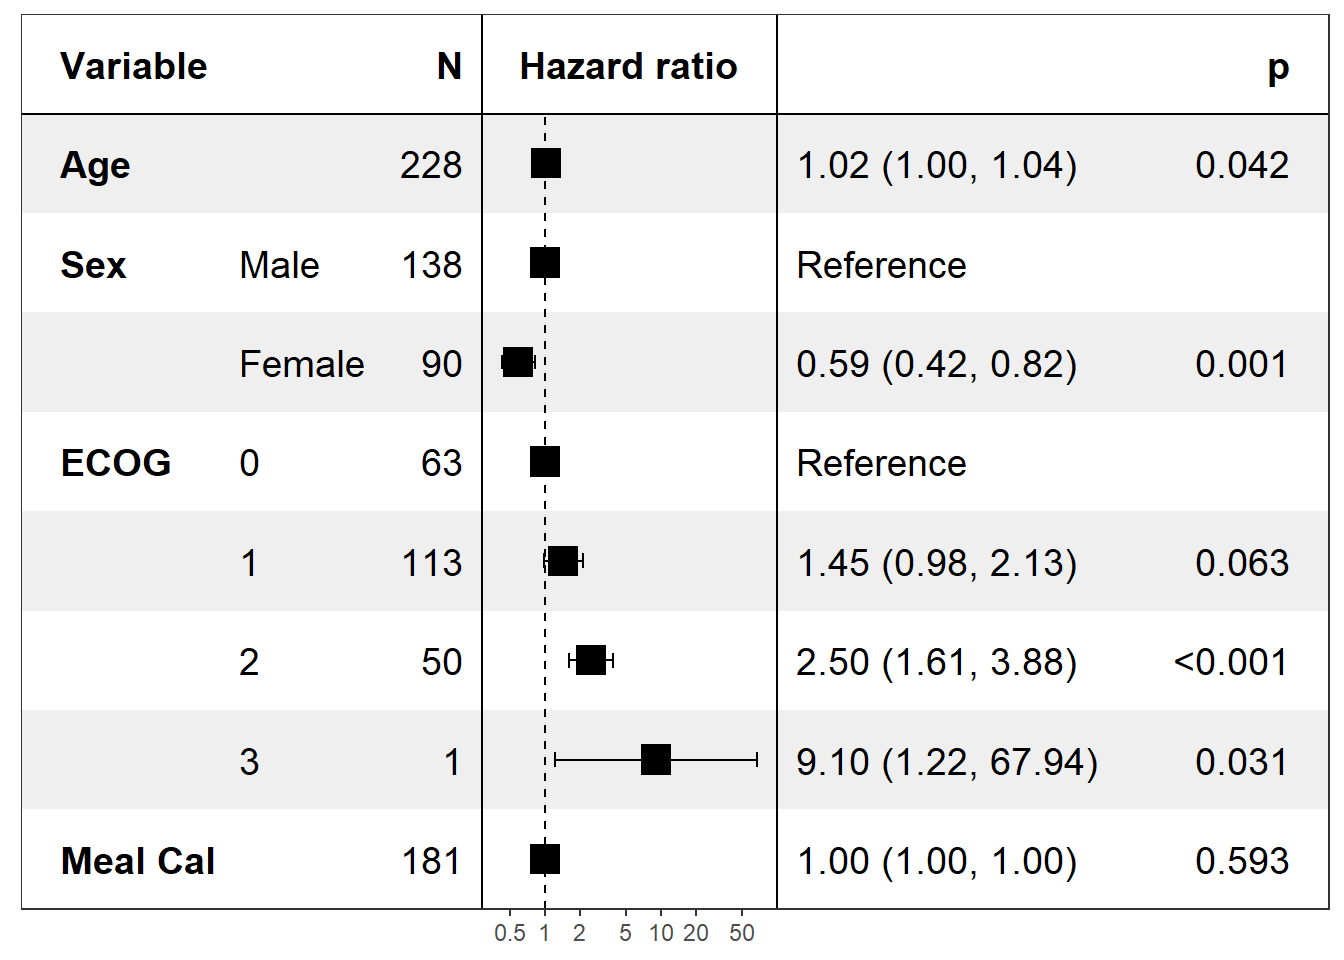
Multivariate - Forest plot based on a cox model
model <- coxph(Surv(time, status) ~ ., data=pretty_lung)
model$xlevels <- unname(model$xlevels) # to retrieve labels for categorical variables (only for cox models)

print(forest_model(model))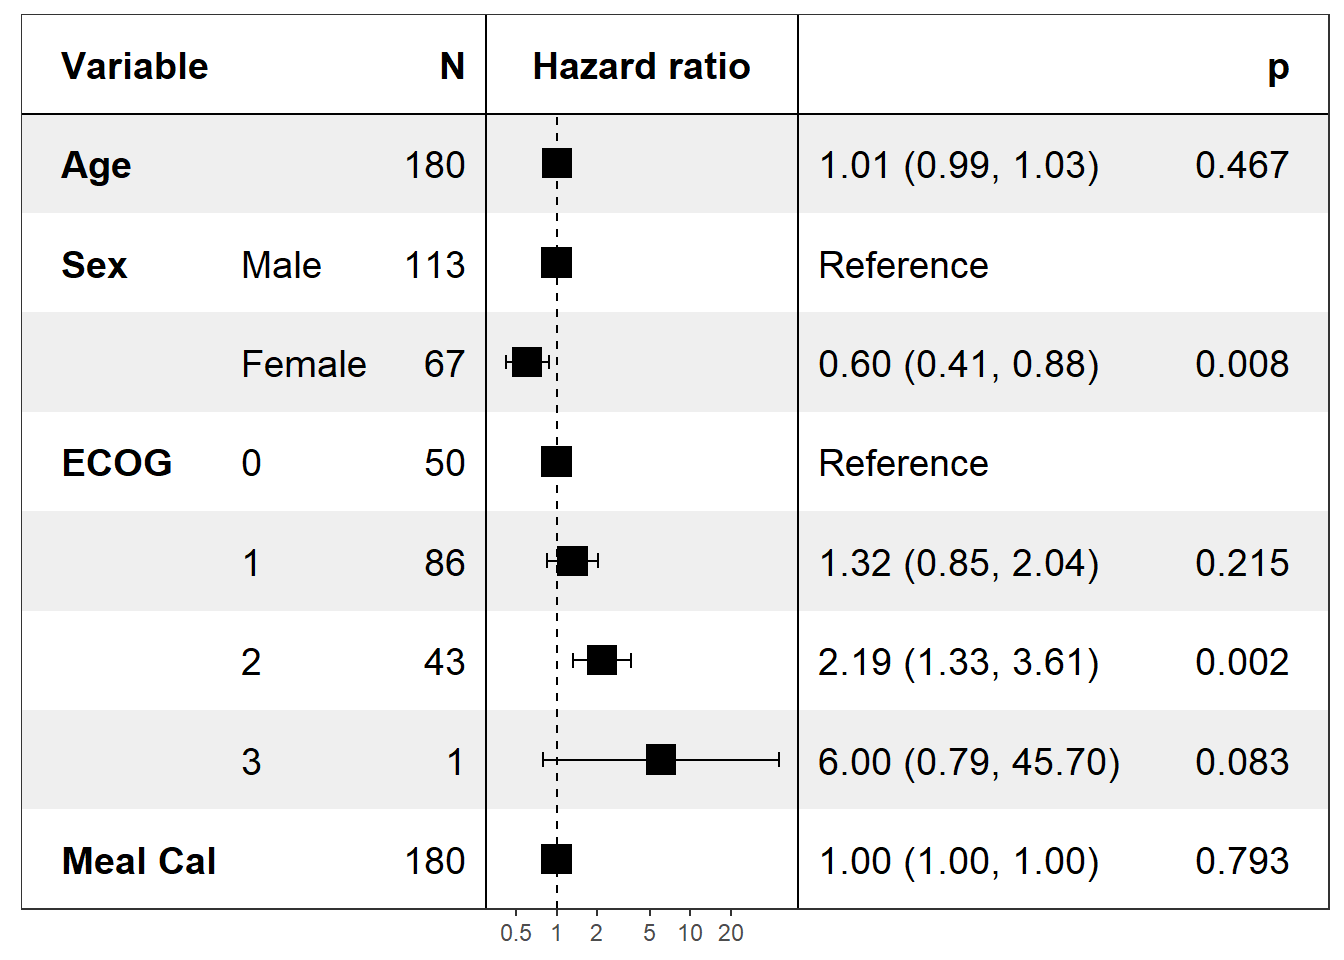
Univariate - Forest plot based on several logistic models
covariates <- c('age','sex')
univ_formulas <- sapply(covariates, function(x) as.formula(paste('status~', x)))
univ_models <- lapply(univ_formulas, function(x){
  model <- glm(x, family='binomial', data=pretty_lung)
  class(model) <- c("myglm",class(model)) # to use by default Wald CI
  return(model)
})
confint.myglm <- confint.default

print(forest_model(model_list = univ_models, covariates = covariates, merge_models = T))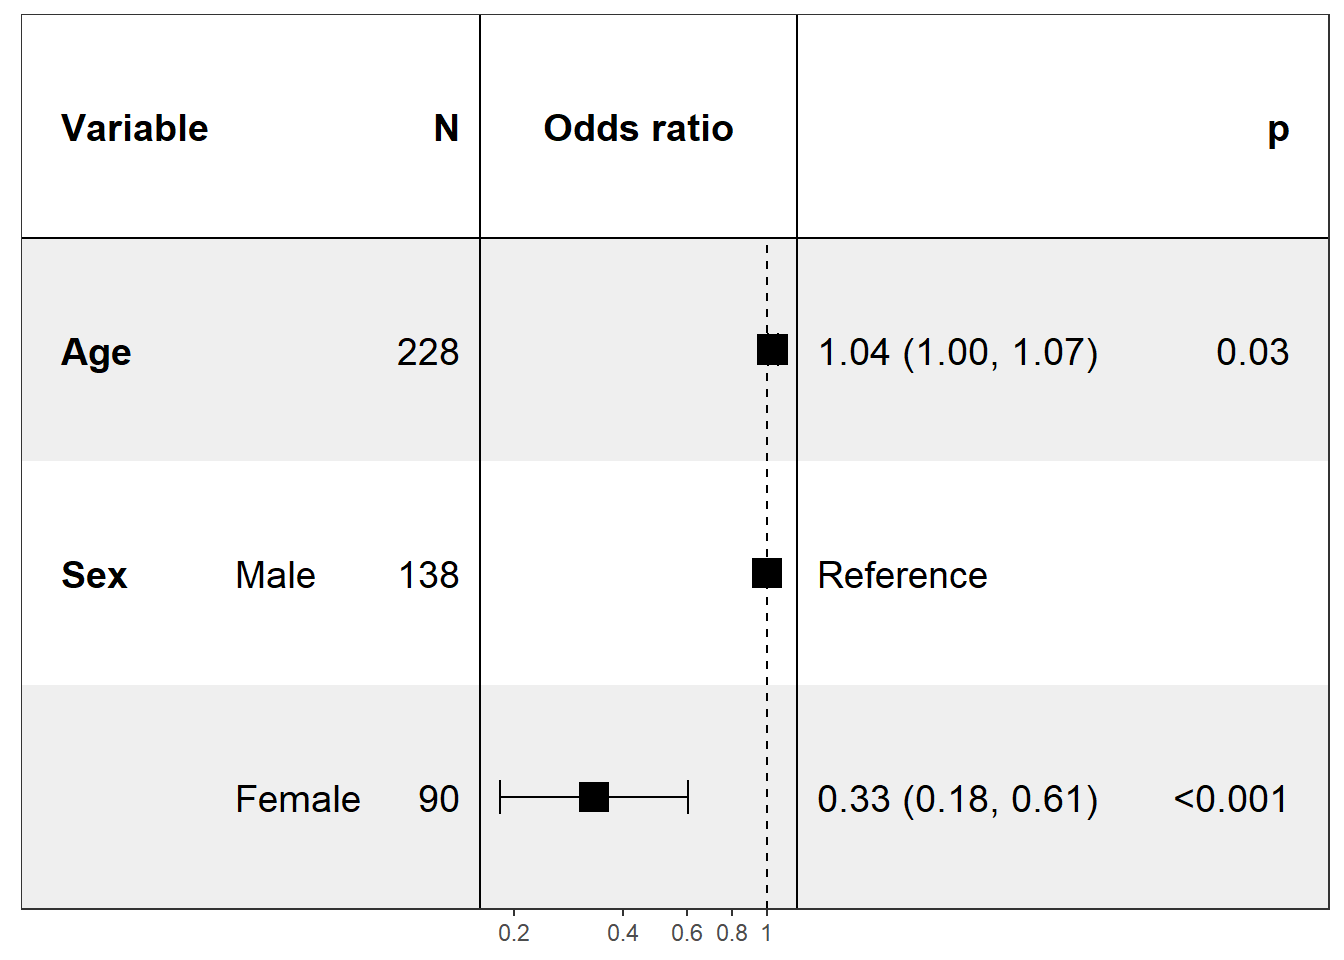
Univariate - Forest plot based on several Cox models
covariates <- c('age','sex','ph.ecog','meal.cal')
univ_formulas <- sapply(covariates, function(x) as.formula(paste('Surv(time, status)~', x)))
univ_models <- lapply(univ_formulas, function(x){
  model <- coxph(x, data=pretty_lung)
  model$xlevels <- unname(model$xlevels) # to retrieve labels for categorical variables (only for cox models)
  return(model)
})

print(forest_model(model_list = univ_models, covariates = covariates, merge_models = T))