We will here use the tabTOX, tabTOX_arm and
plotTOX functions in the Data & Functions
page.
Download Tox_functions.R
# Libraries
library(tidyverse)
library(ggplot2)

# Creation of datasets
set.seed(1234)
n_AE <- 300
n_pat <- 100
df <- data.frame(OBS = sample(1:n_pat, n_AE, replace=T),
                 cat_tox = sample(paste("cat", 1:3), n_AE, replace=T),
                 tox = sample(paste("tox", 1:2), n_AE, replace=T),
                 tox_bis = sample(paste("tox", 1:20), n_AE, replace=T),
                 grade = sample(c(1, 2, 3, 4, 5, NA), n_AE, prob=c(0.3, 0.3, 0.2, 0.1, 0.05, 0.05), replace=T)) %>% arrange(OBS)
df$ARM <- ifelse(df$OBS%in%1:50, 'A', 'B')

df_bis <- data.frame(NAME = rep(paste("tox", 1:8), each=2),
                     N = sample(0:(n_pat/2), 16, replace=T),
                     ARM = rep(c('A', 'B'), 8))
plotTOX function
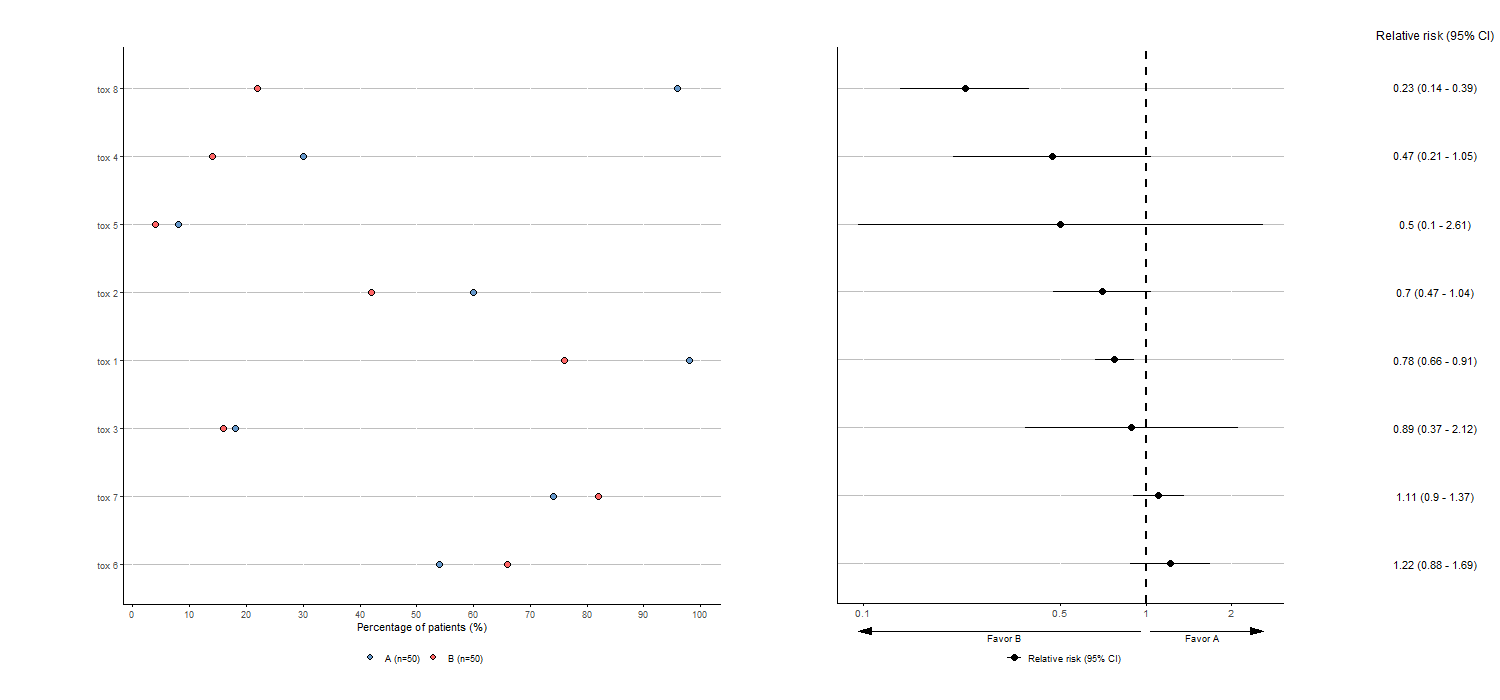
Here is an example of adverse events visualization for two groups comparison without the optional arguments:
tabae4 <- plotTOX(baz=df, id="OBS", var="tox_bis",
                  n=c(n_pat/2,n_pat/2), arm="ARM", langue="en")
tabae4$plot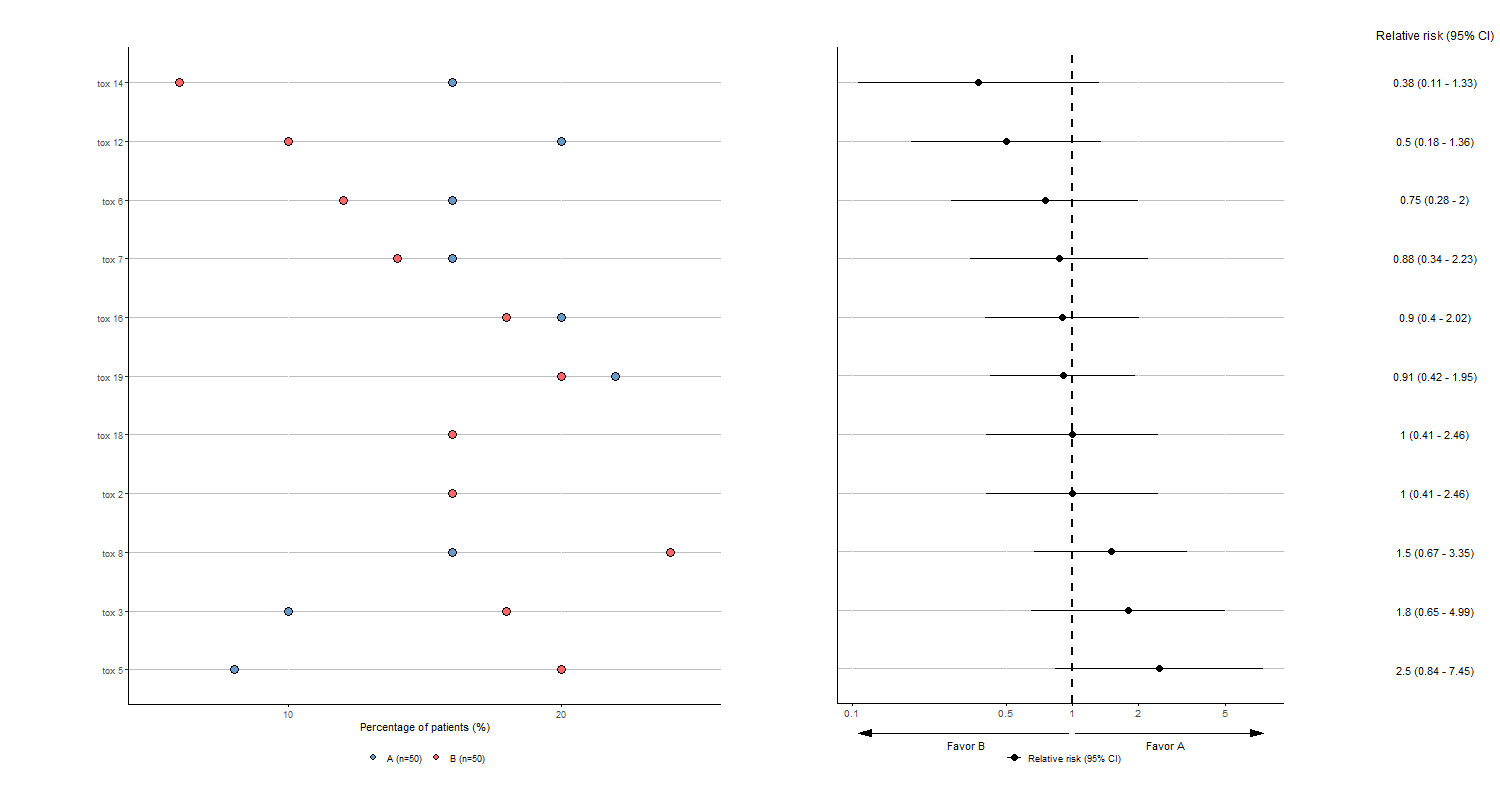
We can:
- Suppress toxicity for which both groups have a percentage less than 15% and add arrow for directional difference
tabae5 <- plotTOX(baz=df, id="OBS", var="tox_bis",
                  n=c(n_pat/2,n_pat/2), arm="ARM", langue="en",
                  percent_supp=15, favors=c("Favor B", "Favor A"),
                  y_favors_arrow=-0.1, y_favors_text=-0.3)
tabae5$plot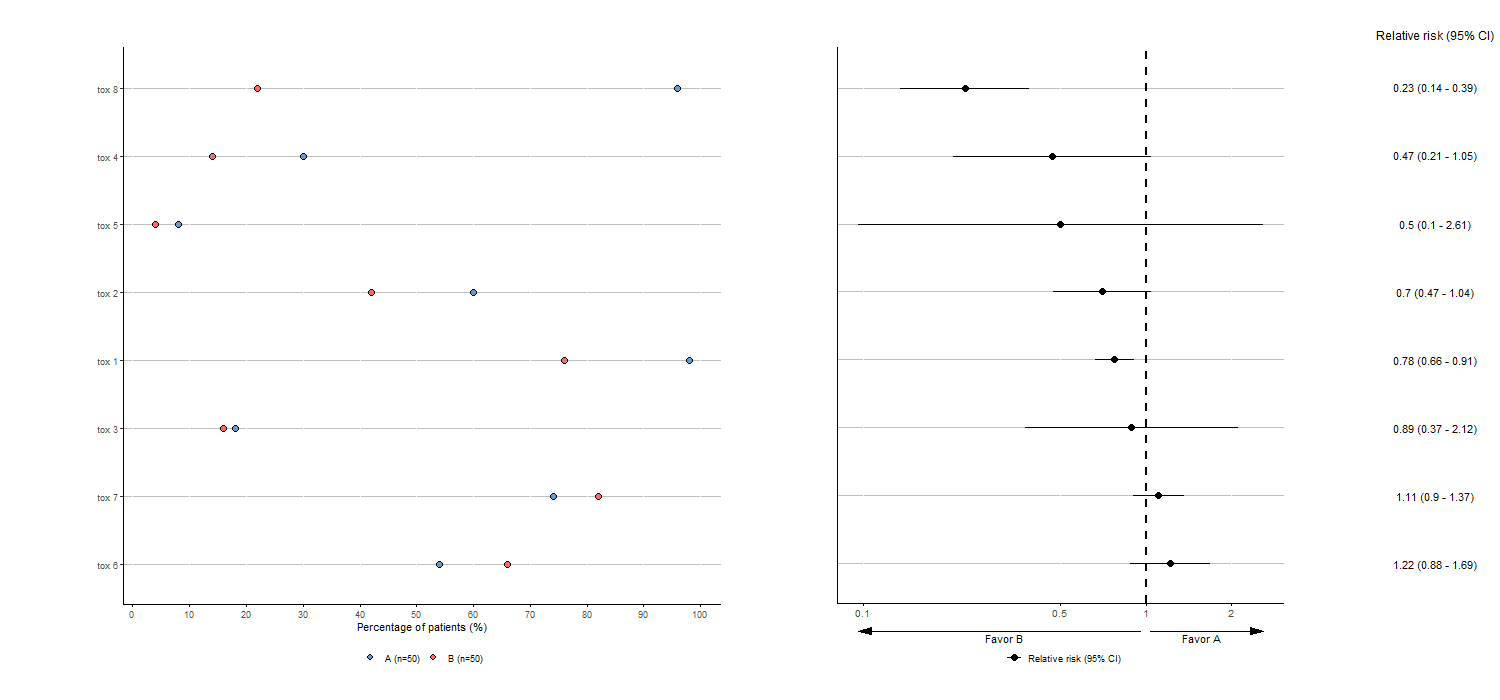
- Give directly a dataframe with three variables (in data frame
df_bis,NAMEindicates the type of toxicity,Nthe number of patients affected by the toxicity and the last one the randomization arm for which name can be given in the argumentarmof the function)
tabae6 <- plotTOX(baz=df_bis, id="OBS", var="tox_bis",
                  n=c(n_pat/2,n_pat/2), arm="ARM", langue="en",
                  y_favors_arrow=0, y_favors_text=-0.1)
tabae6$plot