naniar package
The missing data can be checked using functions included in the
naniar package (see also packages VIM and
mice). There are functions that are useful for structural
understanding and summarization of missing values. The following is a
list of functions implemented in this package:
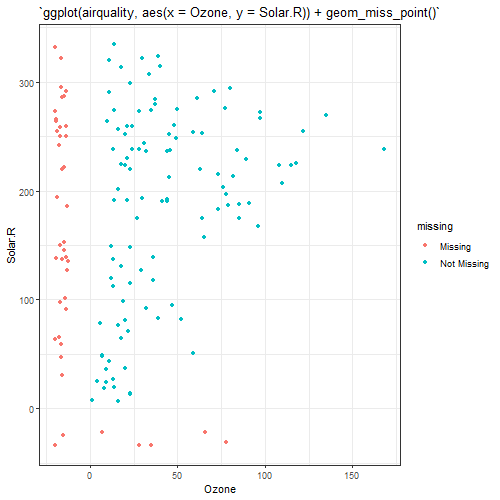
n_var_miss()returns number of missing variables.miss_var_summary()creates a summary table of missing variables, their proportions, for each variable.miss_case_summary()creates a summary table of the number of misses and the proportion of misses for each individual.miss_var_span()creates a summary table of the number of missings in a given span, or breaksize, for a single selected variable.geom_miss_point()visualizes missing values on the same axes as the regular values, colours the missing and not missing points.gg_miss_var()visualizesmiss_var_summary()function results.gg_miss_case()visualizesmiss_case_summary()function results.gg_miss_span()visualizesmiss_var_span()function results.gg_miss_case_cumsum()visualizes cumulative sum of missing values, reading the rows of the dataset from the top to bottom.gg_miss_var_cumsum()visualizes cumulative sum of missing values, reading columns from the left to the right of your dataframe.gg_miss_upset()visualizes combinations of missingness and intersections of missingness amongst variables.gg_miss_fct()visualizes number of missings in each column, broken down by a categorical variable from the dataset.gg_miss_which()visualizes a set of rectangles that indicate whether there is a missing element in a column or not.vis_miss()visualizes missing status with individuals/variables.
Below is an example of applying these functions to
airquality data:
# Libraries
library(naniar)
library(ggplot2)

# Creation of dataset
set.seed(123)
data(airquality)
airquality$Temp[sample(1:nrow(airquality), size=10)] <- NA
airquality$Day[sample(1:nrow(airquality), size=50)] <- NA| Ozone | Solar.R | Wind | Temp | Month | Day |
|---|---|---|---|---|---|
| 41 | 190 | 7.4 | 67 | 5 | 1 |
| 36 | 118 | 8.0 | 72 | 5 | 2 |
| 12 | 149 | 12.6 | 74 | 5 | 3 |
| 18 | 313 | 11.5 | 62 | 5 | 4 |
| NA | NA | 14.3 | 56 | 5 | 5 |
| 28 | NA | 14.9 | 66 | 5 | NA |
| variable | n_miss | pct_miss |
|---|---|---|
| Day | 50 | 32.679739 |
| Ozone | 37 | 24.183007 |
| Temp | 10 | 6.535948 |
| Solar.R | 7 | 4.575163 |
| Wind | 0 | 0.000000 |
| Month | 0 | 0.000000 |
| case | n_miss | pct_miss |
|---|---|---|
| 43 | 3 | 50.00000 |
| 5 | 2 | 33.33333 |
| 6 | 2 | 33.33333 |
| 25 | 2 | 33.33333 |
| 26 | 2 | 33.33333 |
| 27 | 2 | 33.33333 |
| span_counter | n_miss | n_complete | prop_miss | prop_complete | n_in_span |
|---|---|---|---|---|---|
| 1 | 7 | 18 | 0.2800000 | 0.7200000 | 25 |
| 2 | 10 | 15 | 0.4000000 | 0.6000000 | 25 |
| 3 | 6 | 19 | 0.2400000 | 0.7600000 | 25 |
| 4 | 12 | 13 | 0.4800000 | 0.5200000 | 25 |
| 5 | 5 | 20 | 0.2000000 | 0.8000000 | 25 |
| 6 | 8 | 17 | 0.3200000 | 0.6800000 | 25 |
| 7 | 2 | 1 | 0.6666667 | 0.3333333 | 3 |
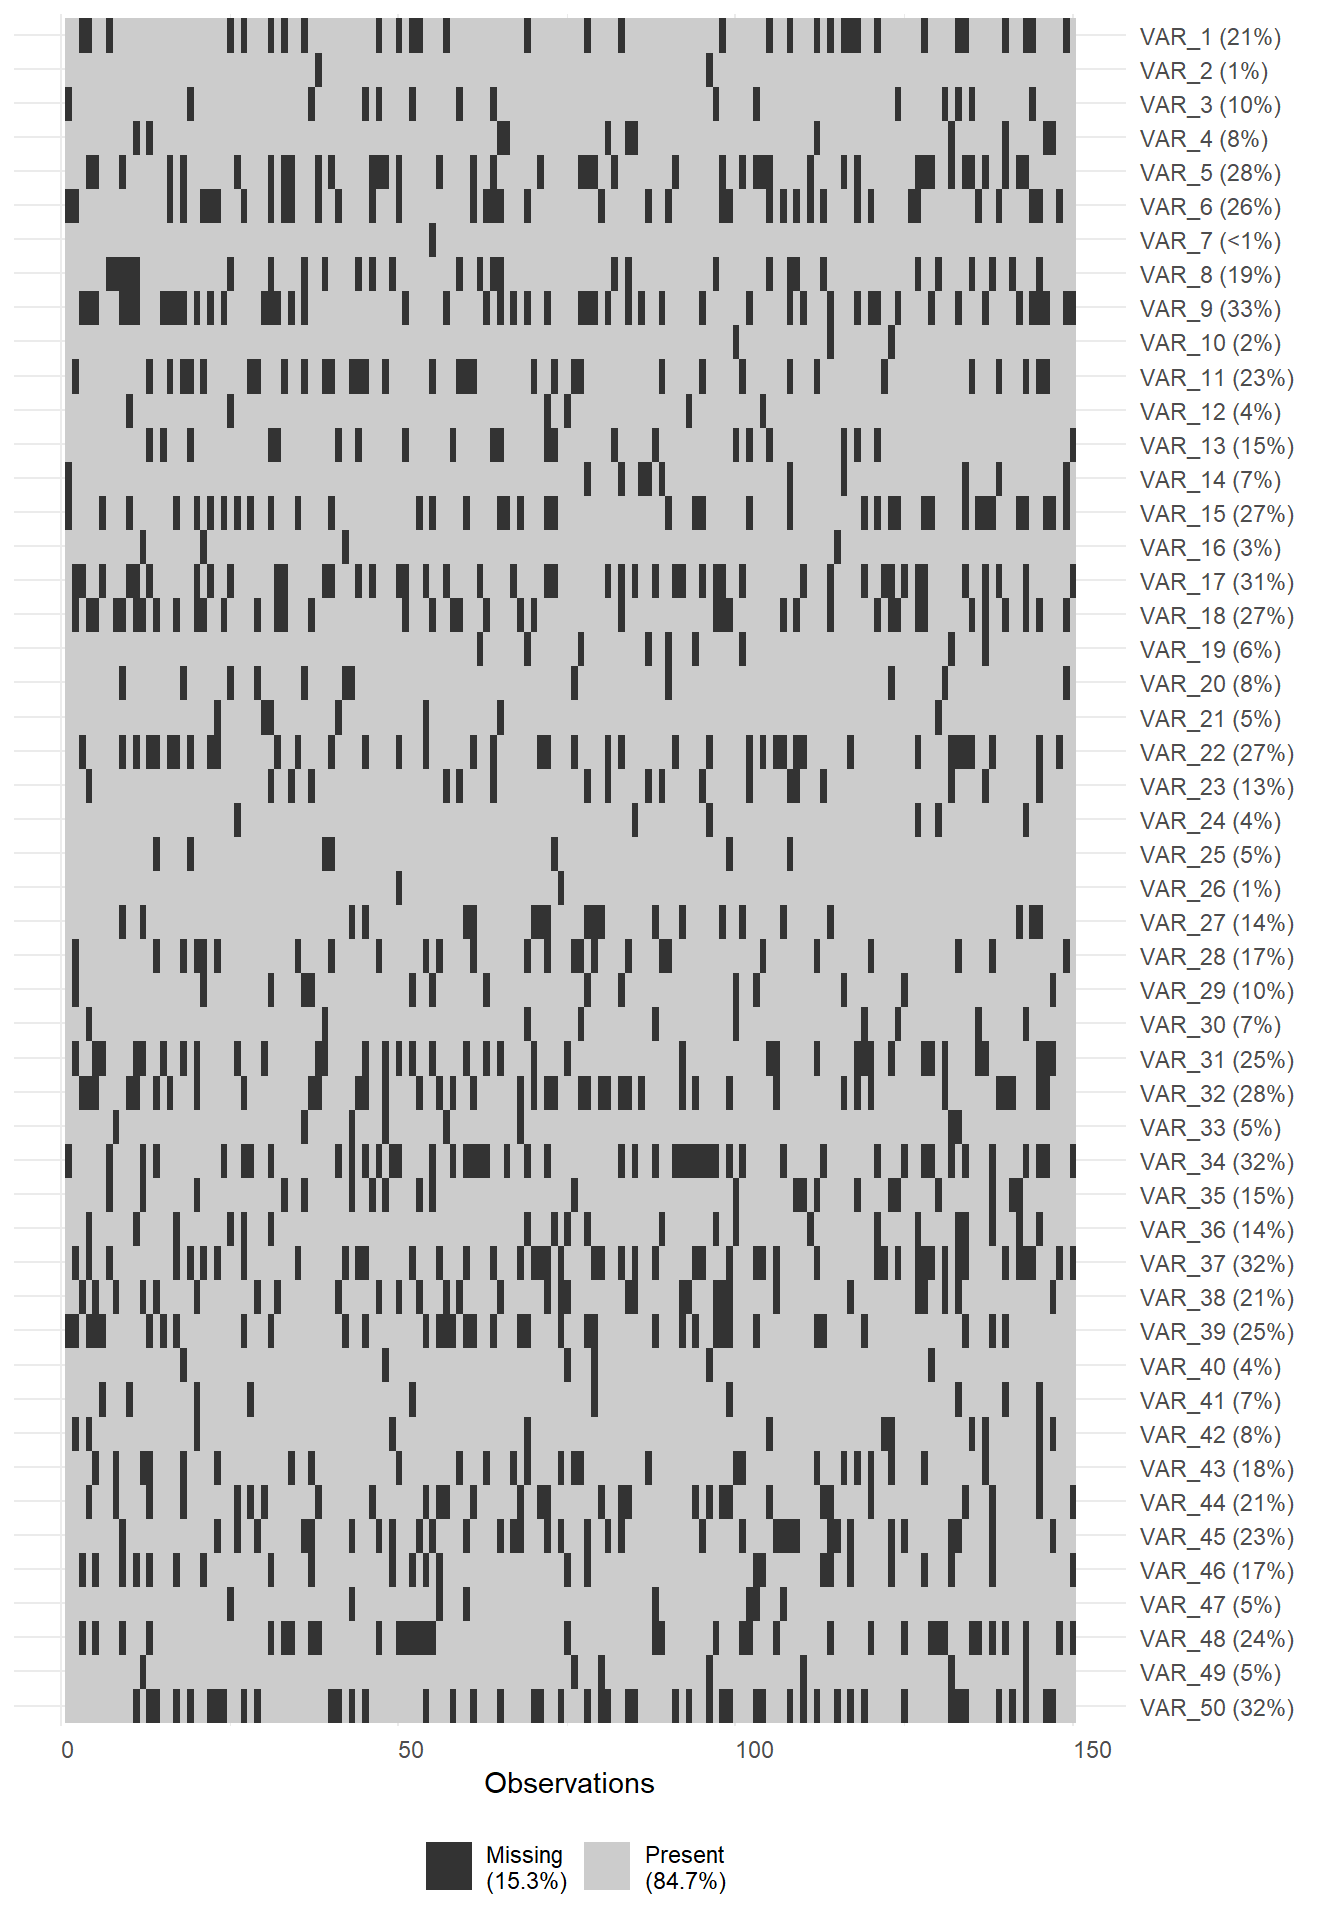
vis_miss1 function
Last update date : 08/08/2024
This function is an update of vis_miss function that
visualizes a dataframe to display missingness. Additional arguments have
been added, for example to flip the coordinates (observations in columns
rather than rows). The arguments of this function are given below
(additional arguments and those of vis_miss). It returns a
ggplot of the missingness inside a dataframe, colouring cells according
to missingness, where black indicates a missing cell and grey indicates
a present cell. As it returns a ggplot object, it is very easy to
customize and change labels.
Arguments
vis_miss1(
x, a dataframe.
cluster = FALSE, logical. TRUE specifies that you want to
use hierarchical clustering (mcquitty method) to arrange rows according
to missingness. FALSE specifies that you want to leave it as is. Default
value is FALSE.
sort_miss = FALSE, logical. TRUE
arranges the columns in order of missingness. Default value is FALSE.
show_perc = TRUE, logical. TRUE now adds in the % of
missing/complete data in the whole dataset into the legend. Default
value is TRUE.
show_perc_col = TRUE, logical. TRUE
adds in the % missing data in a given column into the x axis. Can be
disabled with FALSE. Default value is TRUE.
large_data_size = 9e+05, integer default is 900000 (given
by nrow(data.frame) * ncol(data.frame)).
warn_large_data = TRUE, logical - warn if there is large
data.
flip = FALSE, flip the coordinates if TRUE
(observations in columns).
vect.var = NULL, variable
names.
vect.names = NULL, variables names we want to
display.
varassoc = NULL, “parent” variables that
imply nested responses. Put “” if no “parent” variable.
codassoc = NULL, code that would lead to the response of a
nested variable. obs = NULL variable name for observations.
)
Here is an example where optional parameters are used:
# Libraries
library(naniar)


# Create data
set.seed(8)
data <- data.frame(
  ID = as.character(1:150)
)

len <- sample(1:50, size=50, replace=TRUE)
for(i in 1:50){
  ind <- sample(1:nrow(data), size=len[i])
  data[,paste0("VAR_",i)] <- sample(1:50, size=nrow(data), replace=TRUE)
  data[,paste0("VAR_",i)][ind] <- NA
}


# Plot
vect_var <- names(data)[-1]
vect_nom <- names(data)[-1]
# VAR_2 if VAR_1=12
var_assoc <- rep("",length(vect_var))
var_assoc[vect_var%in%"VAR_2"] <- "VAR_1"
cod_assoc <- rep("",length(vect_var))
cod_assoc[vect_var%in%"VAR_2"] <- "12"
plot_miss <- vis_miss1(data, sort_miss = FALSE, flip=TRUE, #obs="ID",
                       vect.var = vect_var, vect.names = vect_nom,
                       varassoc = var_assoc, codassoc = cod_assoc)