Sample data set
In order to create a Sankey diagram in ggplot2 you will need to
install the ggsankey library and transform your dataset
using the make_long function from the package. The columns
of the data must represent x (the current stage),
next_x (the following stage), node (the
current node) and next_node (the following node). Note that
the last stage should point to an NA.
# Libraries
# install.packages("remotes")
# remotes::install_github("davidsjoberg/ggsankey")
library(ggsankey)

# Creation of dataset
set.seed(123)
n <- 100
data <- data.frame(
  patient = 1:n,
  val_inclusion = sample(c("cmml", "inflammatory", "non normal", "normal"), size = n, replace = T, prob = c(0.7, 0.2, 0.08, 0.02)),
  val_M3 = sample(c("cmml", "inflammatory", "non normal", "normal"), size = n, replace = T, prob = c(0.3, 0.2, 0.4, 0.1)),
  val_M6 = sample(c("cmml", "inflammatory", "non normal", "normal"), size = n, replace = T, prob = c(0.15, 0.05, 0.7, 0.1))
)

# convert for the sankey plot
df <- data %>%
  make_long(val_inclusion, val_M3, val_M6)
Sankey plot with ggsankey
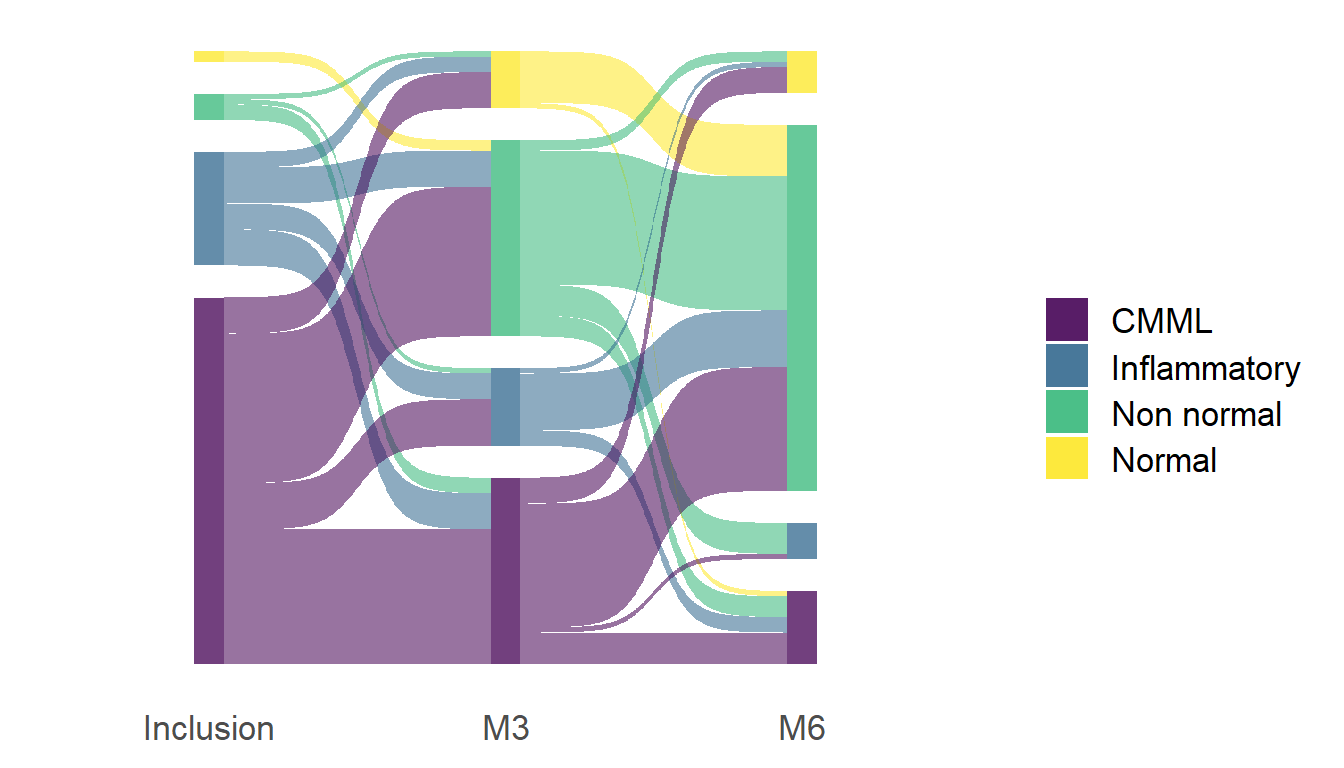
The ggsankey package contains a geom named
geom_sankey to create the Sankey diagrams in ggplot2. Note
that you will need to pass the variables to aes, specifying
a factor as the fill color. The function also contains a theme named
theme_sankey.
# Libraries
library(ggsankey)
library(ggplot2)
library(dplyr)

# Sankey plot
ggplot(df, aes(x = x,
                next_x = next_x,
                node = node,
                next_node = next_node,
                fill = factor(node))) +
   geom_sankey() +
   theme_sankey(base_size = 16)+
   geom_sankey(flow.alpha = 0.1) +
   # geom_sankey(flow.alpha = 0.1, node.color = 1) +
   scale_fill_viridis_d(alpha = 0.5, labels=c("CMML","Inflammatory","Non normal","Normal")) +
   theme(axis.title.x = element_blank())+
   scale_x_discrete(labels=c("Inclusion", "M3", "M6")) +
   # theme(legend.position = "none") +
   guides(fill = guide_legend(title = ""))