Data
We use the data frame called sleepstudy from the package
lme4. We add a fourth column to gather the subjects in 3
groups.
# Libraries
library(lme4)
library(ggplot2)

# Load dataset
data("sleepstudy")

# 4th column for the last plot
sleepstudy$Group <- factor((c(rep(c("1"), times =70), rep(c("2"), times =60), rep(c("3"), times =50))))
sleepstudy format:
A data frame with 180 observations on the following 3 variables:
Reaction Average reaction time (ms)
Days
Number of days of sleep deprivation
Subject Subject
number on which the observation was made
Group Three
groups of subjects
| Reaction | Days | Subject | Group |
|---|---|---|---|
| 249.5600 | 0 | 308 | 1 |
| 258.7047 | 1 | 308 | 1 |
| 250.8006 | 2 | 308 | 1 |
| 321.4398 | 3 | 308 | 1 |
| 356.8519 | 4 | 308 | 1 |
| 414.6901 | 5 | 308 | 1 |
| 382.2038 | 6 | 308 | 1 |
| 290.1486 | 7 | 308 | 1 |
Spaghetti plot
geom_line and geom_point functions
geom_line(
mapping, Set of
aesthetic mappings created by aes()
data, The data
stat = "identity", The
statistical transformation to use on the data for this layer, as a
string
position = "identity", Position adjustment,
either as a string, or the result of a call to a position adjustment
function
na.rm = FALSE, FALSE: the default, missing
values are removed with a warning. TRUE: missing values are silently
removed
orientation = NA, The orientation of the
layer. The default (NA) automatically determines the orientation from
the aesthetic mapping
show.legend = NA, logical.
Should this layer be included in the legends?
inherit.aes = TRUE, If FALSE, overrides the default
aesthetics, rather than combining with them. This is most useful for
helper functions that define both data and aesthetics and shouldn’t
inherit behaviour from the default plot specification, e.g. borders()
...
)
geom_point(
mapping, Set of
aesthetic mappings created by aes()
data, The data
stat = "identity", The
statistical transformation to use on the data for this layer, as a
string
position = "identity", Position adjustment,
either as a string, or the result of a call to a position adjustment
function
na.rm = FALSE,FALSE: the default, missing
values are removed with a warning. TRUE: missing values are silently
removed
show.legend = NA, logical. Should this layer
be included in the legends?
inherit.aes = TRUE, If
FALSE, overrides the default aesthetics, rather than combining with
them. This is most useful for helper functions that define both data and
aesthetics and shouldn’t inherit behaviour from the default plot
specification, e.g. borders()
...
)
Spaghetti plot
# Basic spaghetti plot
ggplot(sleepstudy, aes(y=Reaction, x=Days))+
  geom_point()+
  geom_line(aes(group=Subject)) +
  theme_bw()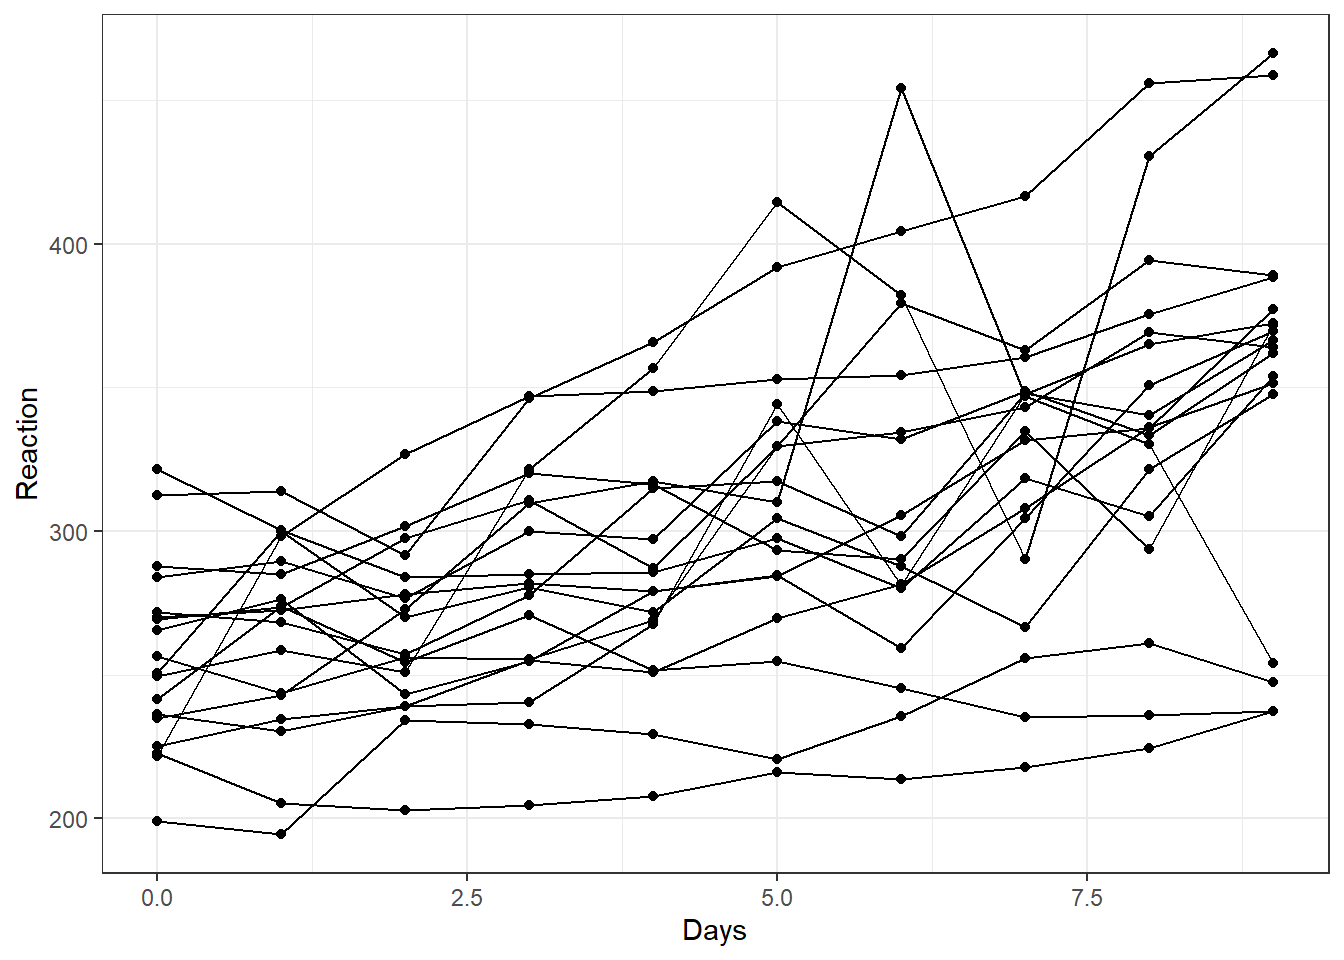
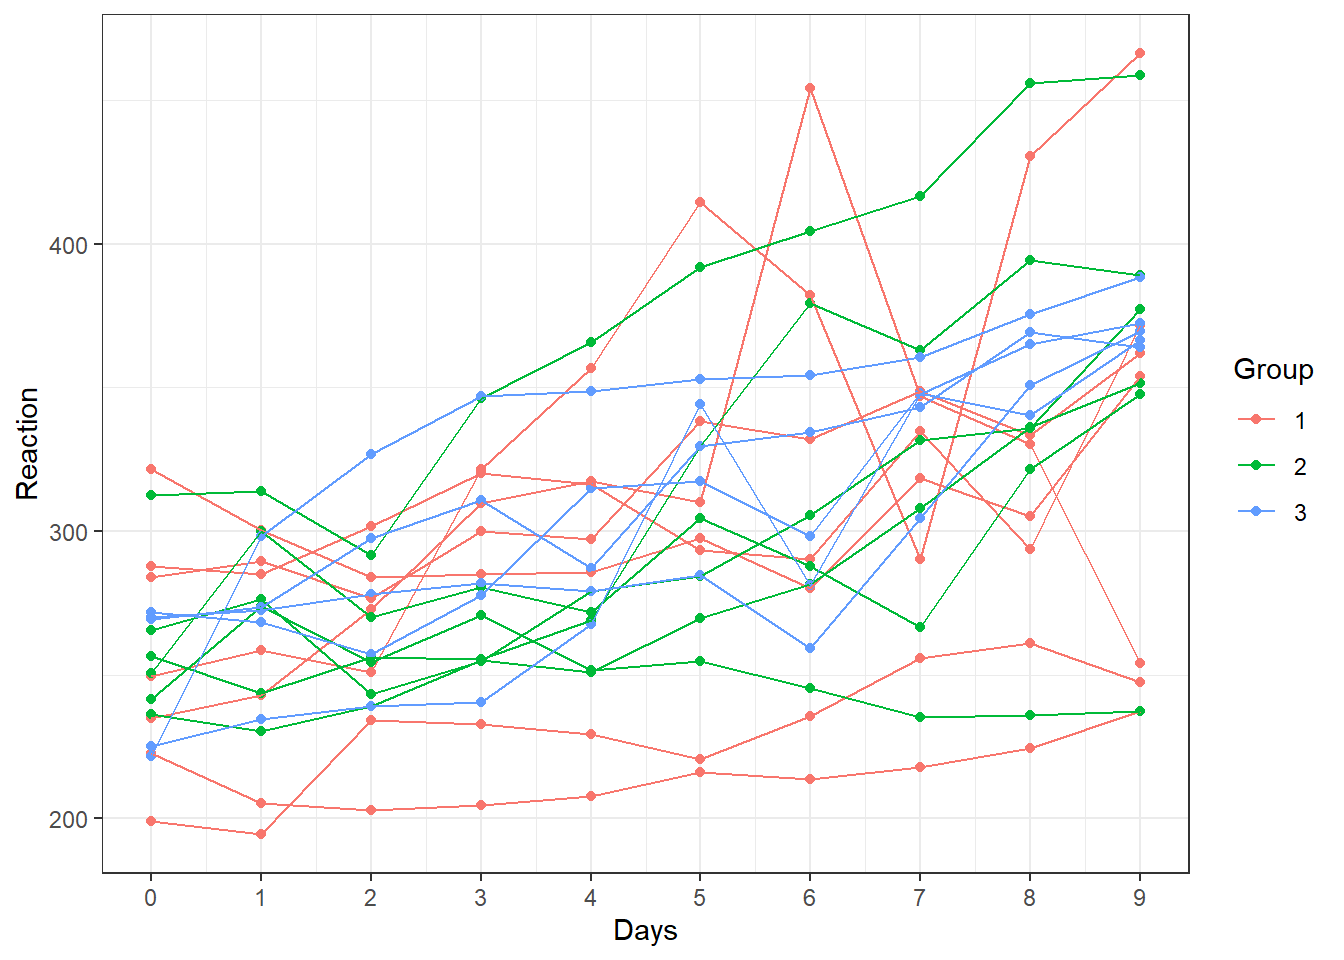
We can then use a different color per group in order to better
visualize the trajectories (by adding color=Group in the
aes function.
# Colorful spaghetti plot
ggplot(sleepstudy, aes(y=Reaction, x=Days, color=Group))+
  geom_point()+
  geom_line(aes(group=Subject))+
  scale_x_continuous(breaks=0:9) +
  theme_bw()