Data & Functions
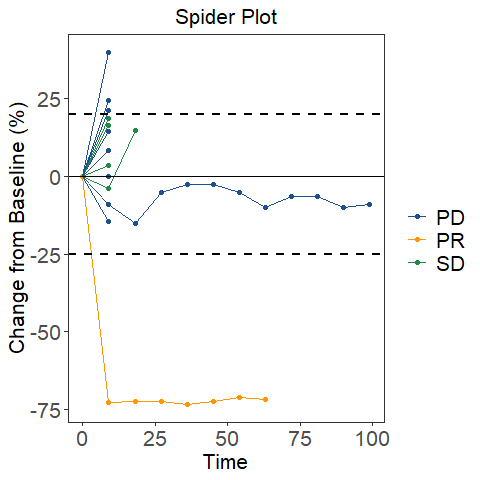
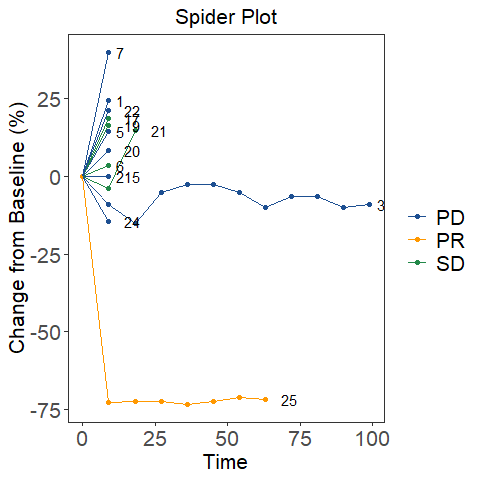
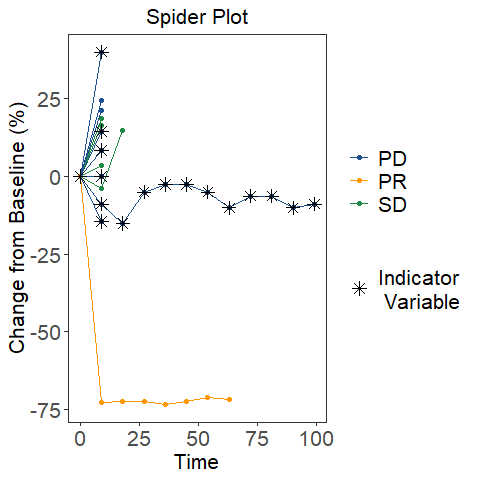
Different options for spider plots
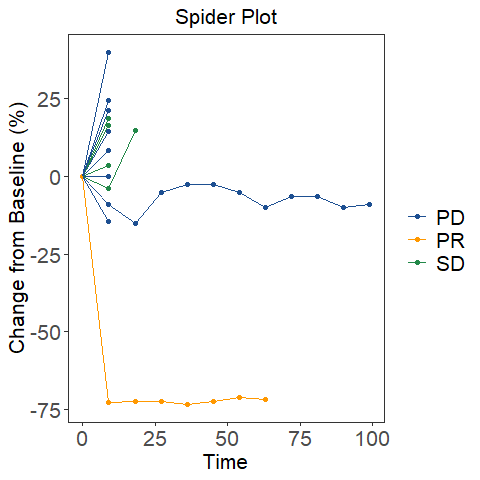
A spider plot is a graphical display where the x-axis is time and the y-axis in the variable of interest and a line is plotted for each individual or patient. These graphs are commonly used to illustrate changes from baseline in tumor volume in cancer clinical trials.