To add information to the swimmer plot we can use the swimmer arrows
function.
We will here use the swimmer_plot function in the Data & Functions page and the
swimmer_arrows() function.
Swimmer_arrows
swimmer_arrows(
df_arrows, a data
frame
id = "id", column name for id
arrow_start = "end", column name with the arrow
locations, default is “end”
cont = NULL, a
column name including an indicator of which ids have an arrow
adj.y = 0, amount to adjust the line within the box
vertically
name_col = NULL, a column name to map the
arrow colour
arrow_positions = c(0.1, 1), a vector of
the distance from the arrow start to end, default is c(0.1,1)
angle = 30, the angle of the arrow head in degrees
length = 0.1, a unit specifying the length of the arrow
head (grom tip to bas in inches)
type = closed, one of
“open” or “closed” indicating whether the arrow head should be a closed
triangle
...
)
swim_plot <- swimmer_plot(df=ClinicalTrial.Arm,id='id',start = 0, end='End_trt',name_fill='Arm',col="black",id_order
            = 'Arm') +
            theme(axis.text.y=element_blank(), # Not display id axis
            axis.ticks.y=element_blank())

# Add arrows
swim_plot_with_arrows <- swim_plot+
swimmer_arrows(df_arrows=ClinicalTrial.Arm,id='id',arrow_start='End_trt',
cont = 'Continued_treatment',name_col='Arm',show.legend = FALSE,type =
"open",cex=1.25)
swim_plot_with_arrows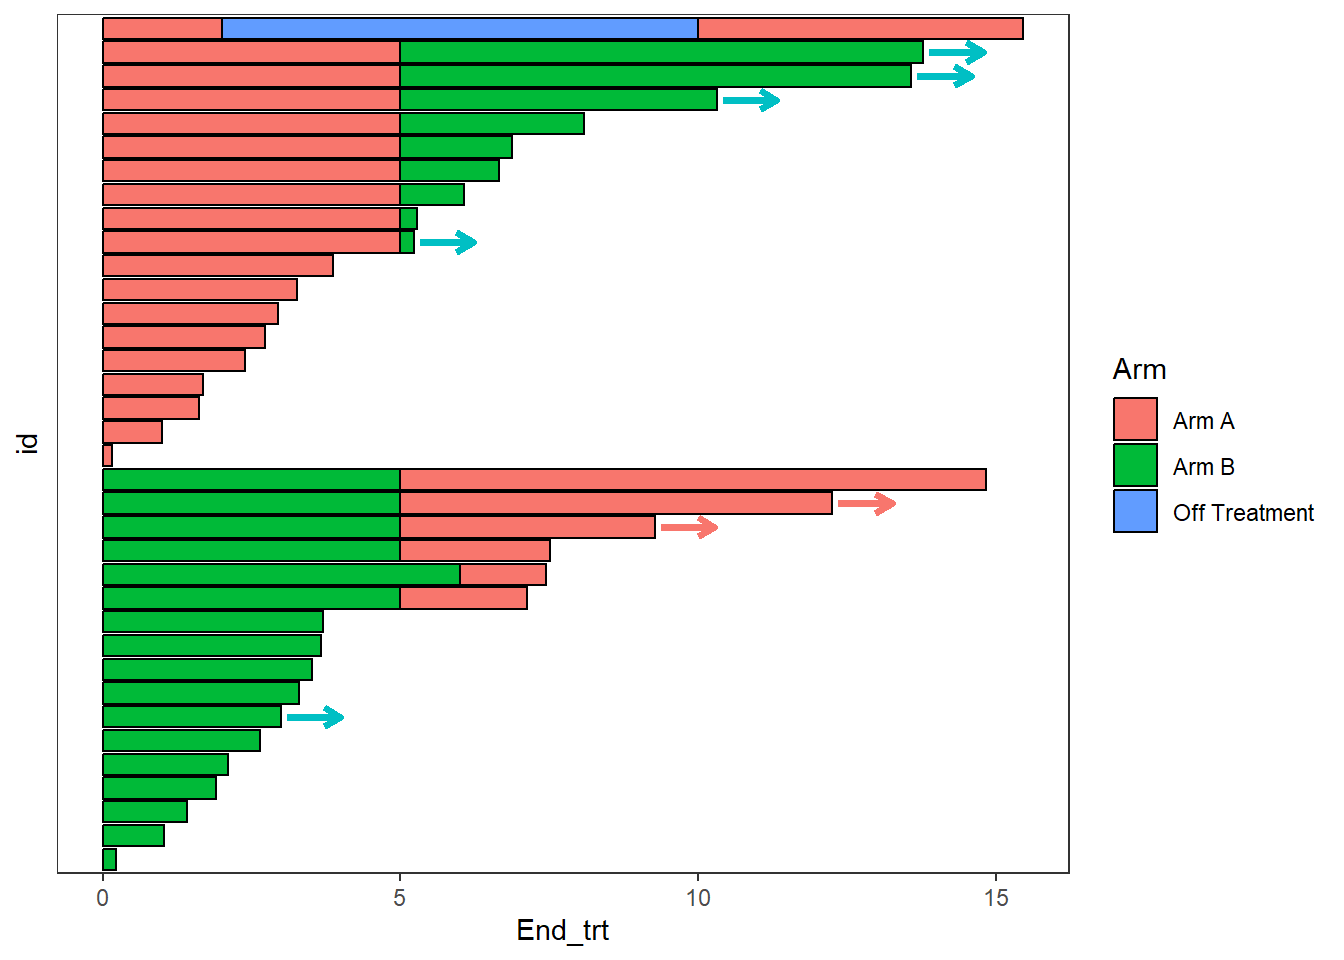
Contact
This document is a work of the statistics team in the Biostatistics and Medical Information Department at Saint-Louis Hospital in Paris (SBIM).
Based on The R Graph Gallery by Yan Holtz.