We will here use the swimmer_plot function in the Data & Functions page and
datasets from an Rdata file:
Download datasets.
# Libraries
library(ggplot2)
library(swimplot)
library(RColorBrewer)

# Load data
load("data_swimmer_example.Rdata")
The simplest example is to represent patient follow-up times, as well as their treatment periods:
# Choose colors
color_custom <- brewer.pal(n = 12, name = 'Set3')
color_custom <- c("induction" = color_custom[1],
                  "HMA cure" = color_custom[2],
                  "consolidation" = color_custom[3],
                  "catch-up" = color_custom[5],
                  "allograft" = color_custom[7],
                  "maintenance" = color_custom[8],
                  "no treatment" = "white",
                  "NA" = "gray")

swimmer_plot(base_swimmer_trt,
             id='ID', start = 0, end='time',
             name_fill='TYPCURE', #id_order='ID',
             col="black", alpha=0.75, width=0.8) +
  scale_fill_manual(values = color_custom) +
  labs(x = "", y = "Time from diagnosis (months)",
       fill = "Type of cure") +
  theme(axis.text.y = element_blank(),
        axis.ticks.y = element_blank()) # to remove patient ID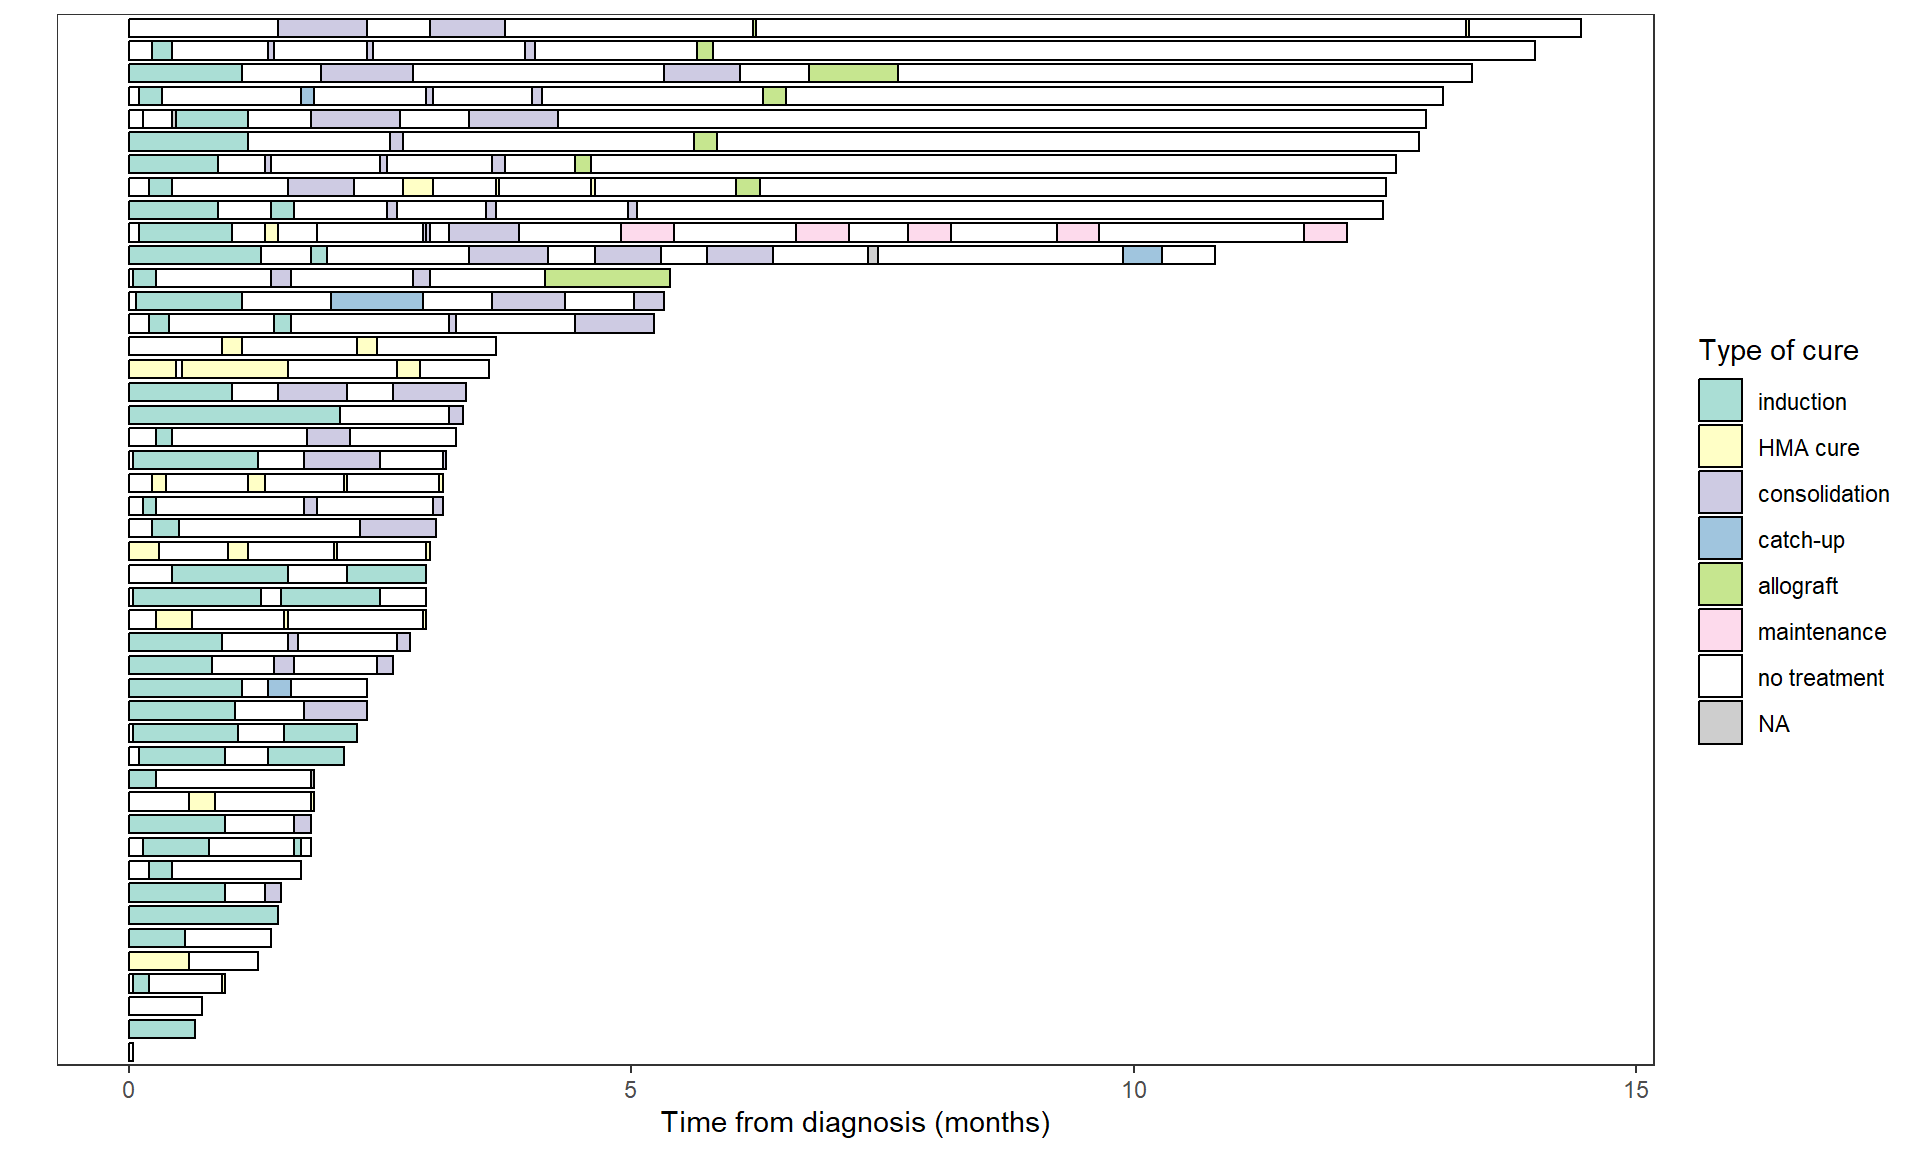
A legend can be added to display deaths and relapses:
swimmer_plot(base_swimmer_trt,
             id='ID', start = 0, end='time',
             name_fill='TYPCURE', #id_order='ID',
             col="black", alpha=0.75, width=0.8) +
  scale_fill_manual(values = color_custom) +
  labs(x = "", y = "Time from diagnosis (months)",
       fill = "Type of cure", color = "Event") +
  theme(axis.text.y = element_blank(),
        axis.ticks.y = element_blank()) + # to remove patient ID
  # Deaths and relapses
  swimmer_points(df_points=base_swimmer_relapsedeath,
                 id='ID', time='time', name_col = 'event',
                 size=2, fill='white', shape=4, stroke=1.1) +
  scale_color_manual(values = c('Death' = '#4d4d4d', 'Relapse' = '#E41A1C'))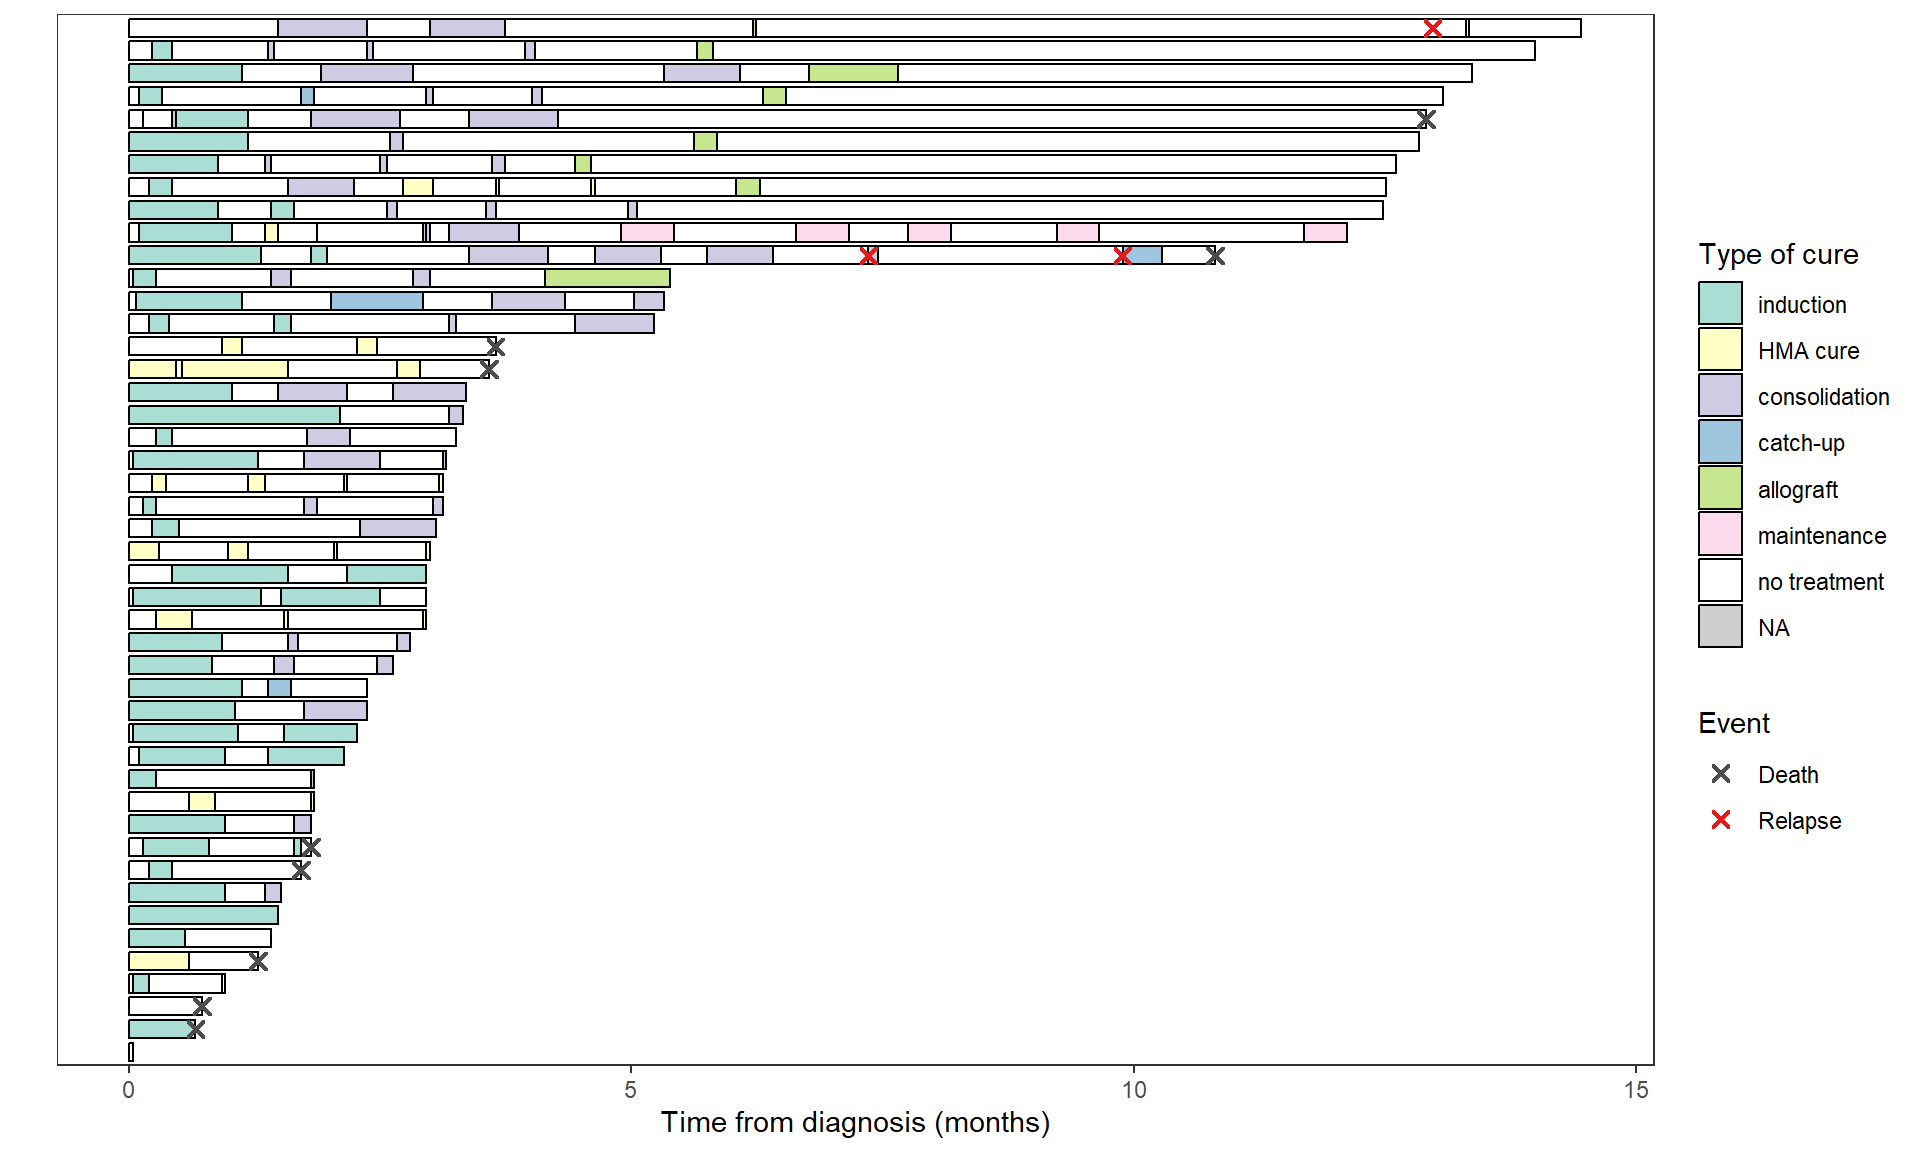
Responses can also be added:
swimmer_plot(base_swimmer_trt,
             id='ID', start = 0, end='time',
             name_fill='TYPCURE', #id_order='ID',
             col="black", alpha=0.75, width=0.8) +
  scale_fill_manual(values = color_custom) +
  labs(x = "", y = "Time from diagnosis (months)",
       fill = "Type of cure", color = "Event", shape = "Response") +
  theme(axis.text.y = element_blank(),
        axis.ticks.y = element_blank()) + # to remove patient ID
  # Deaths and relapses
  swimmer_points(df_points=base_swimmer_relapsedeath,
                 id='ID', time='time', name_col = 'event',
                 size=2, fill='white', shape=4, stroke=1.1) +
  scale_color_manual(values = c('Death' = '#4d4d4d', 'Relapse' = '#E41A1C')) +
  guides(color = guide_legend(override.aes = list(shape = 4))) +
  # Responses
  swimmer_points(df_points=base_swimmer_eval,
                 id='ID', time='time', name_shape = 'LAMREP',
                 size=1.5, fill='white') +
  scale_shape_manual(values=c(16,17,15,3,7,8,1)) # to add a shape for the NAs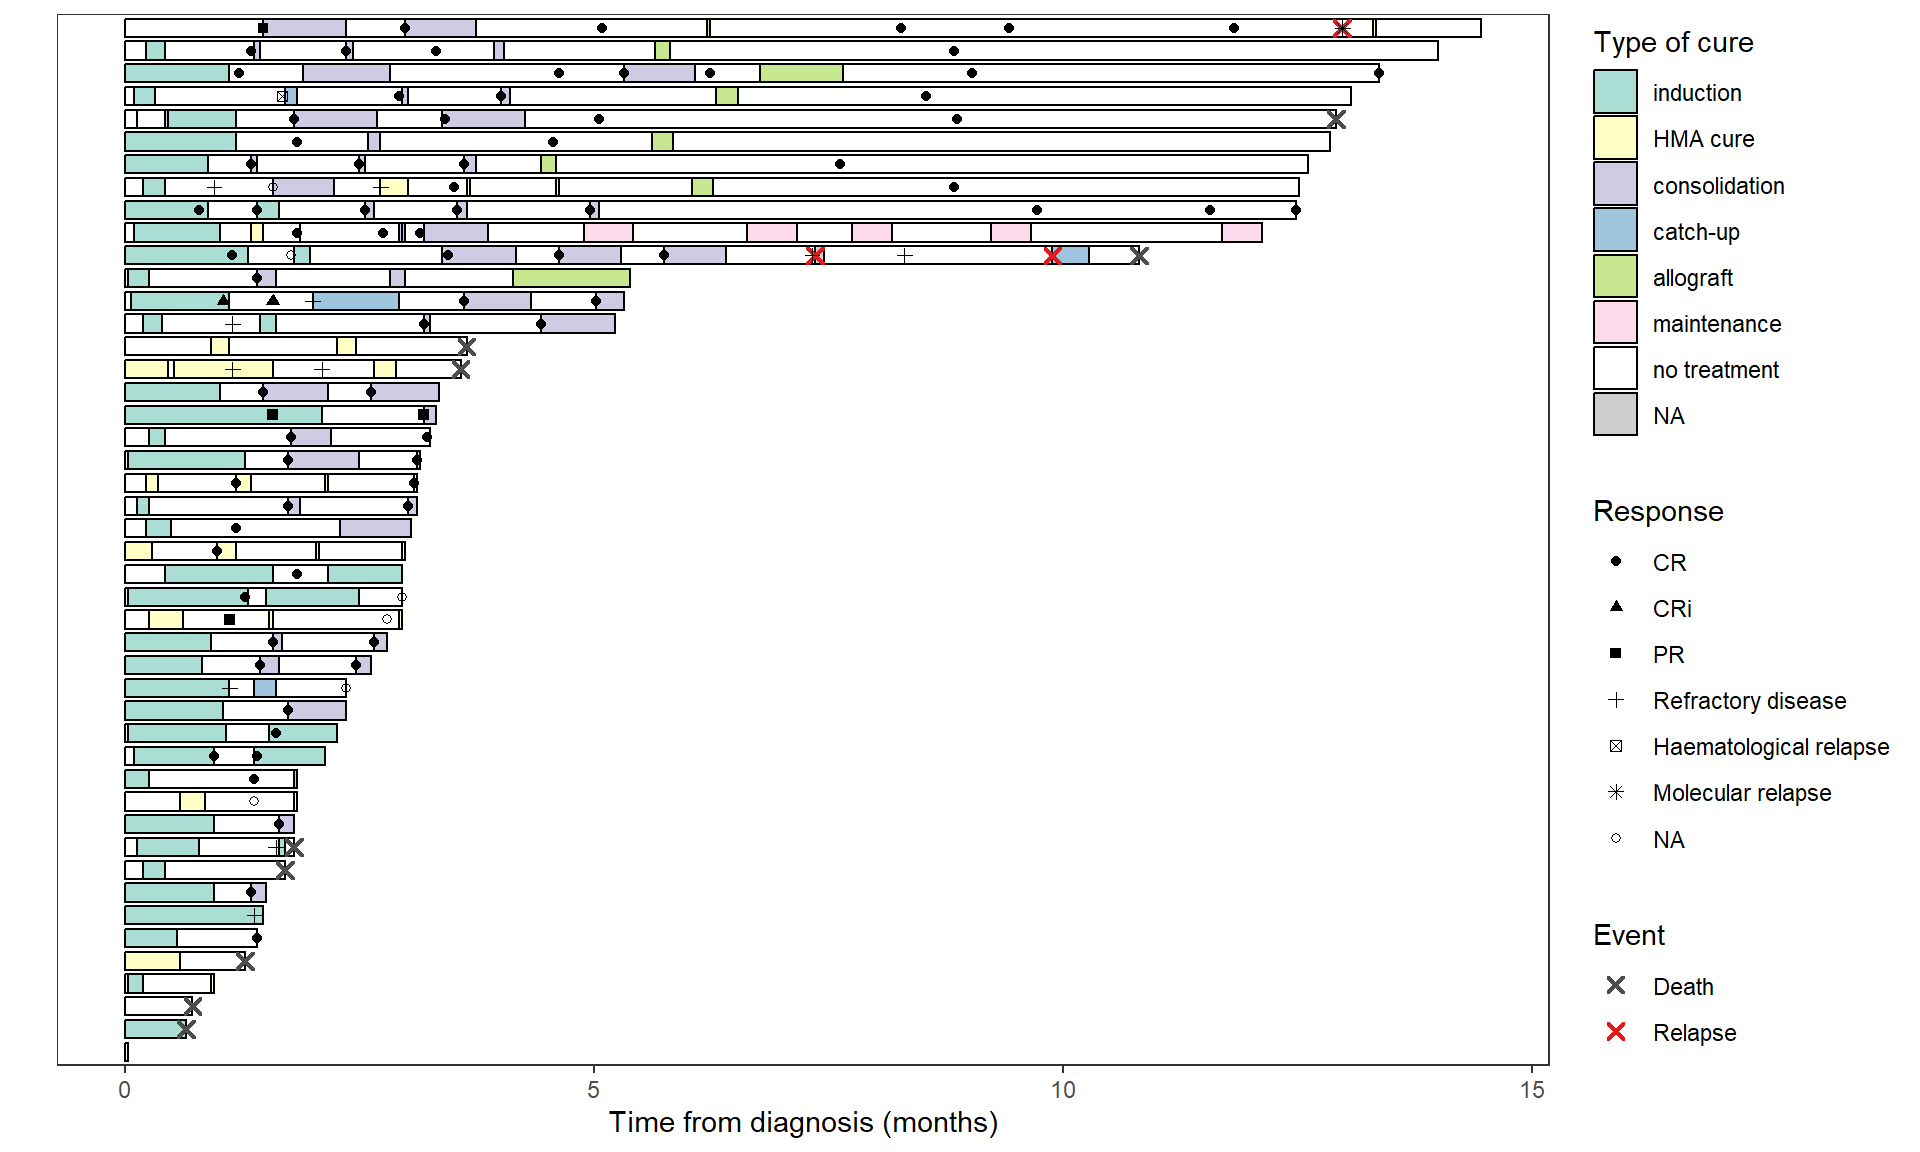
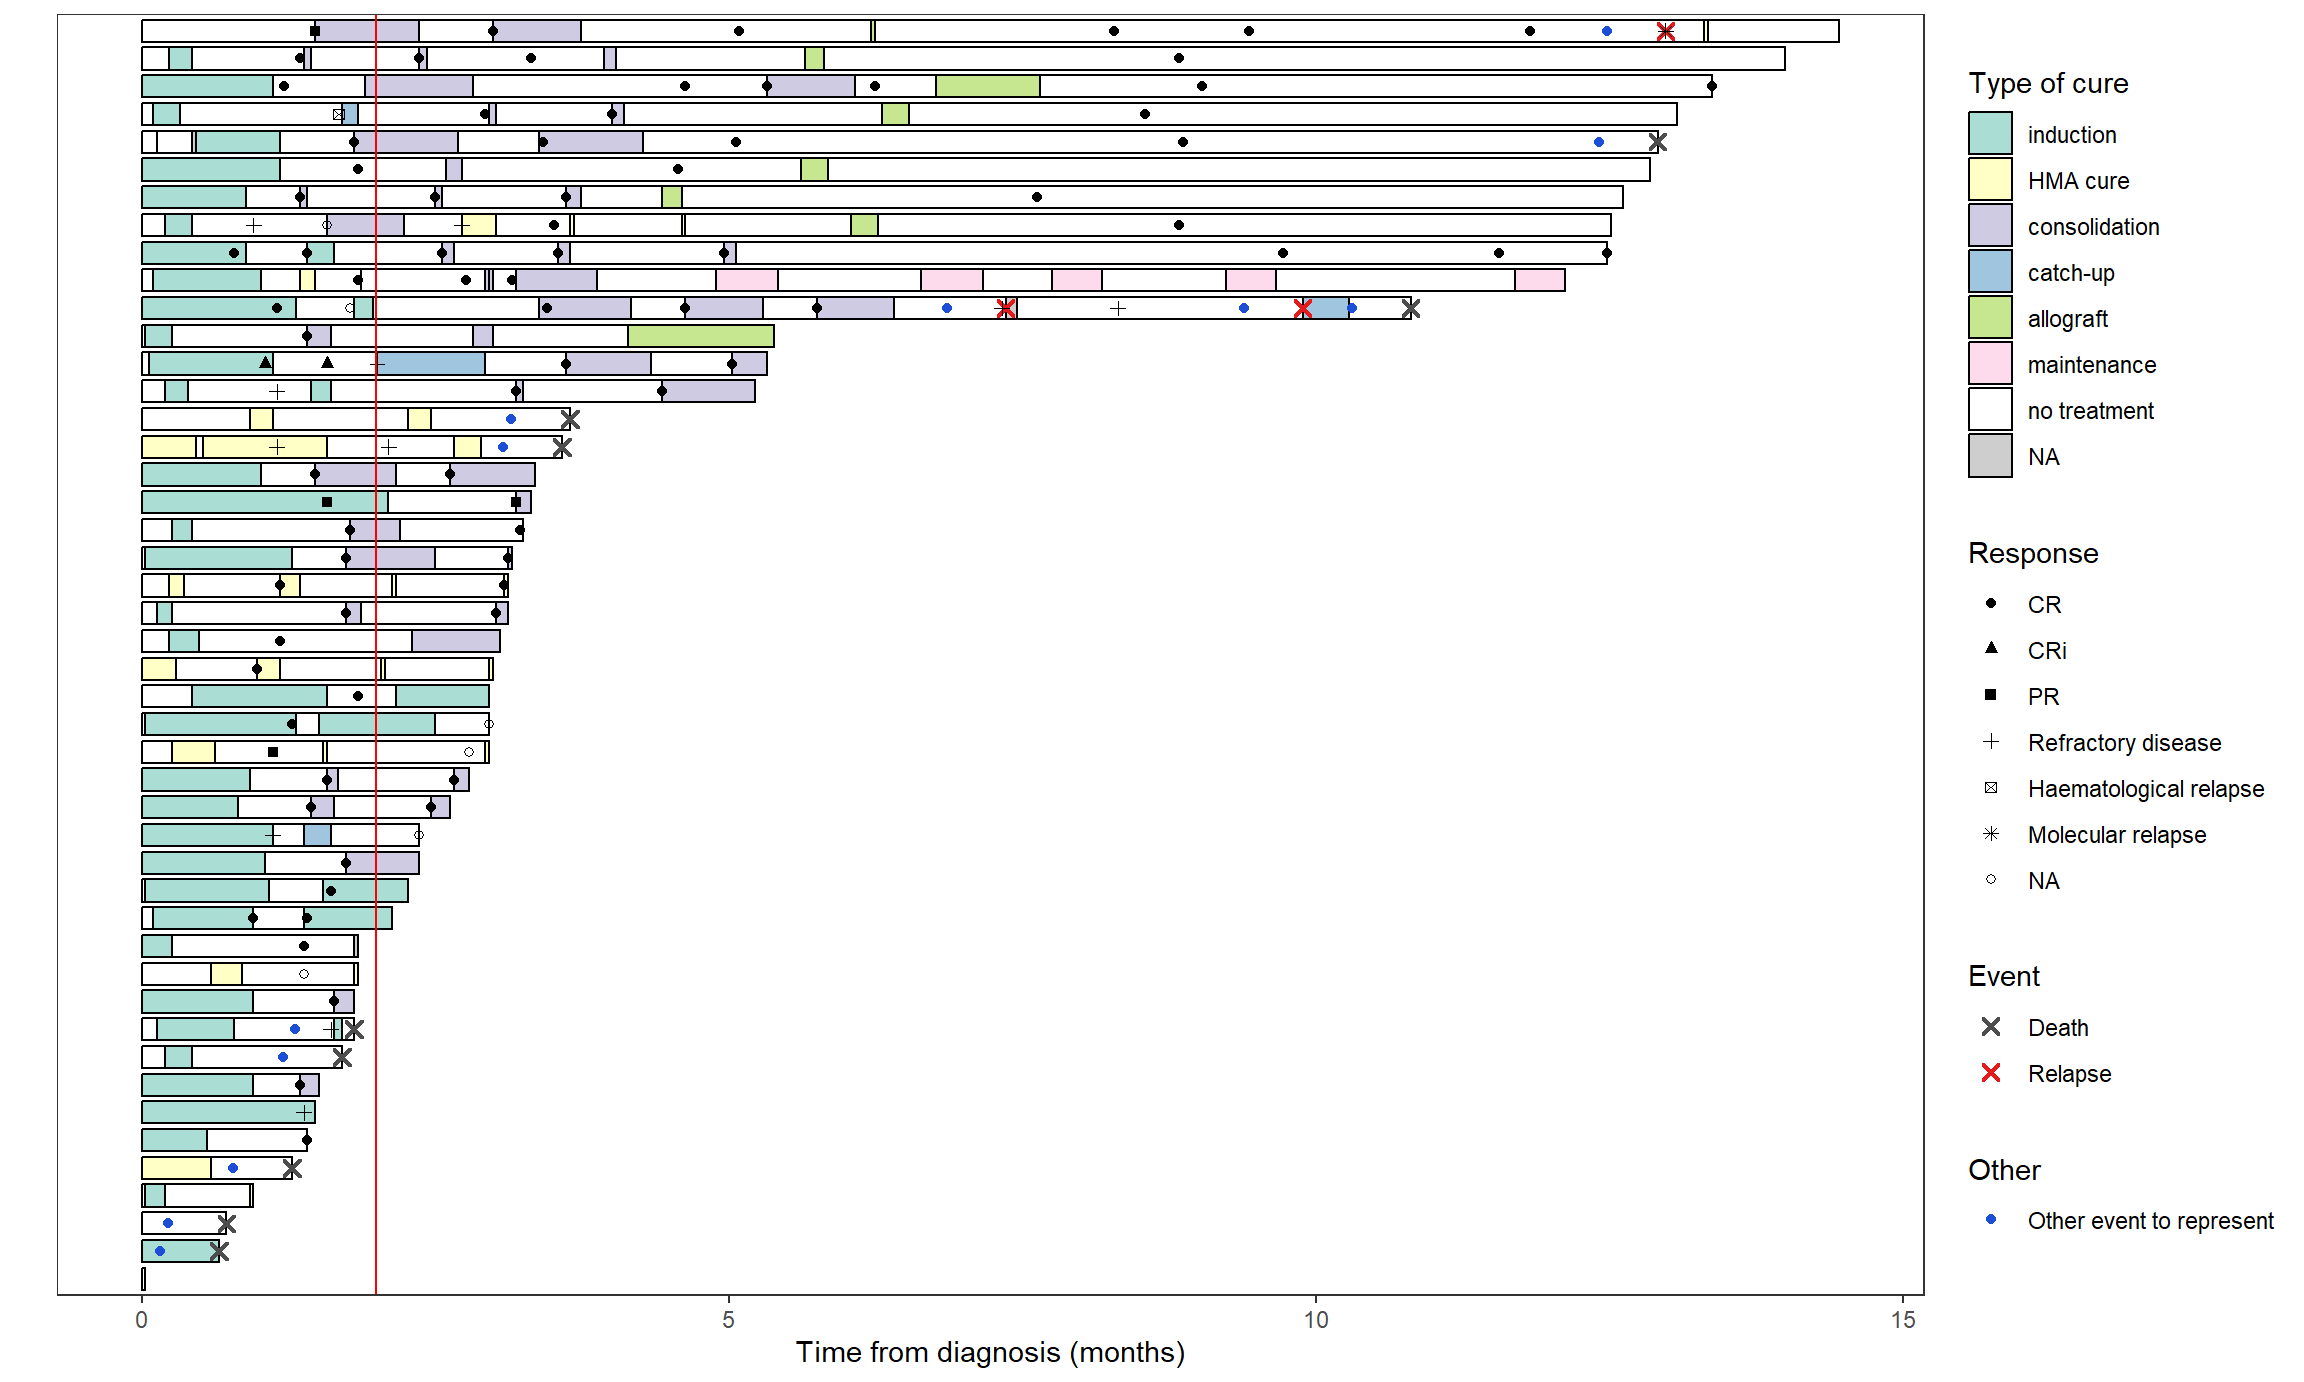
If you want to add an other event in a separate legend:
library(ggnewscale)

swimmer_plot(base_swimmer_trt,
             id='ID', start = 0, end='time',
             name_fill='TYPCURE', #id_order='ID',
             col="black", alpha=0.75, width=0.8) +
  scale_fill_manual(values = color_custom) +
  labs(x = "", y = "Time from diagnosis (months)",
       fill = "Type of cure", color = "Event", shape = "Response") +
  theme(axis.text.y = element_blank(),
        axis.ticks.y = element_blank()) + # to remove patient ID
  # Deaths and relapses
  swimmer_points(df_points=base_swimmer_relapsedeath,
                 id='ID', time='time', name_col = 'event',
                 size=2, fill='white', shape=4, stroke=1.1) +
  scale_color_manual(values = c('Death' = '#4d4d4d', 'Relapse' = '#E41A1C')) +
  guides(color = guide_legend(override.aes = list(shape = 4))) +
  # Responses
  swimmer_points(df_points=base_swimmer_eval,
                 id='ID', time='time', name_shape = 'LAMREP',
                 size=1.5, fill='white') +
  scale_shape_manual(values=c(16,17,15,3,7,8,1)) + # to add a shape for the NAs
  # Others events
  guides(fill = guide_legend(order=1), shape = guide_legend(order=2), colour = guide_legend(order=3)) +
  new_scale_color() + # geoms below will use another color scale
  swimmer_points(df_points=base_swimmer_eventsupp,
                 id='ID', time='time', name_col = 'event',
                 size=1.5, fill='white') +
  scale_color_manual(values = "#1D4ED8") + #, guide = guide_legend(order=2)
  labs(color = "Other") +
  geom_hline(yintercept = 2, color="red")