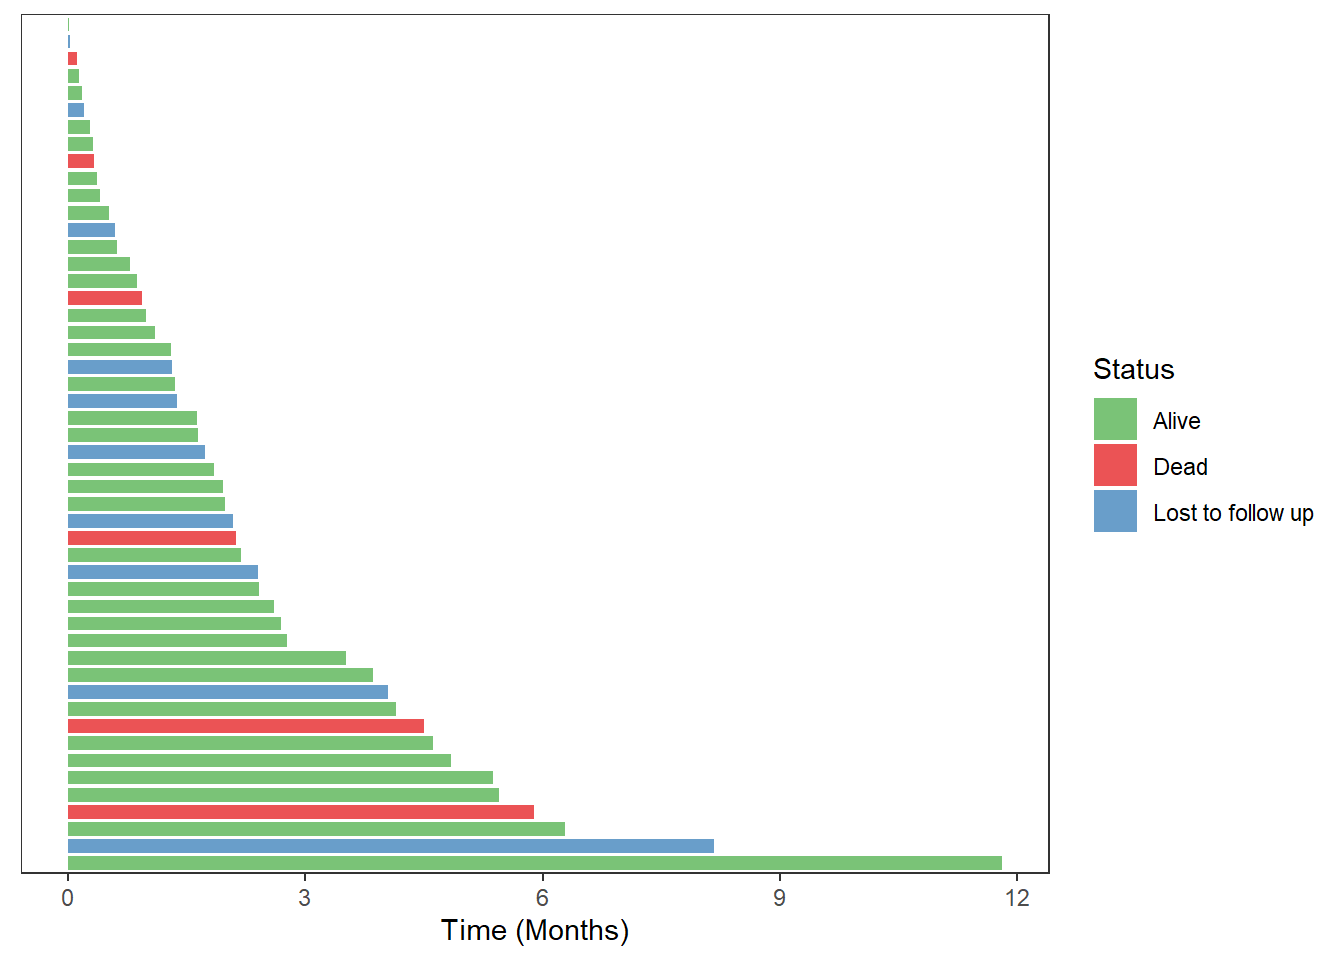
We will here use the swimmer_plot function in the Data & Functions page.
# Libraries
library(ggplot2)
library(swimplot)

# Creation of dataset
set.seed(1931)
ID <- 1:50
Time <- rexp(n = 50, rate = 0.5)
Status <- sample(c("Alive", "Lost to follow up", "Dead"), 50, replace=T, prob = c(0.7, 0.25, 0.05))
base <- data.frame(ID, Time, Status)

# Plot
swplot <- swimmer_plot(base,
                       id='ID',
                       start = 0, end='Time',
                       name_fill='Status',
                       id_order='Time',
                       identifiers=FALSE,
                       alpha=0.75, width=0.8)

swplot +
  ggplot2::scale_fill_manual(name="Status",values=c("#4daf4a", "#e41a1c", "#377eb8"))+
  ggplot2::ylab('Time (Months)')