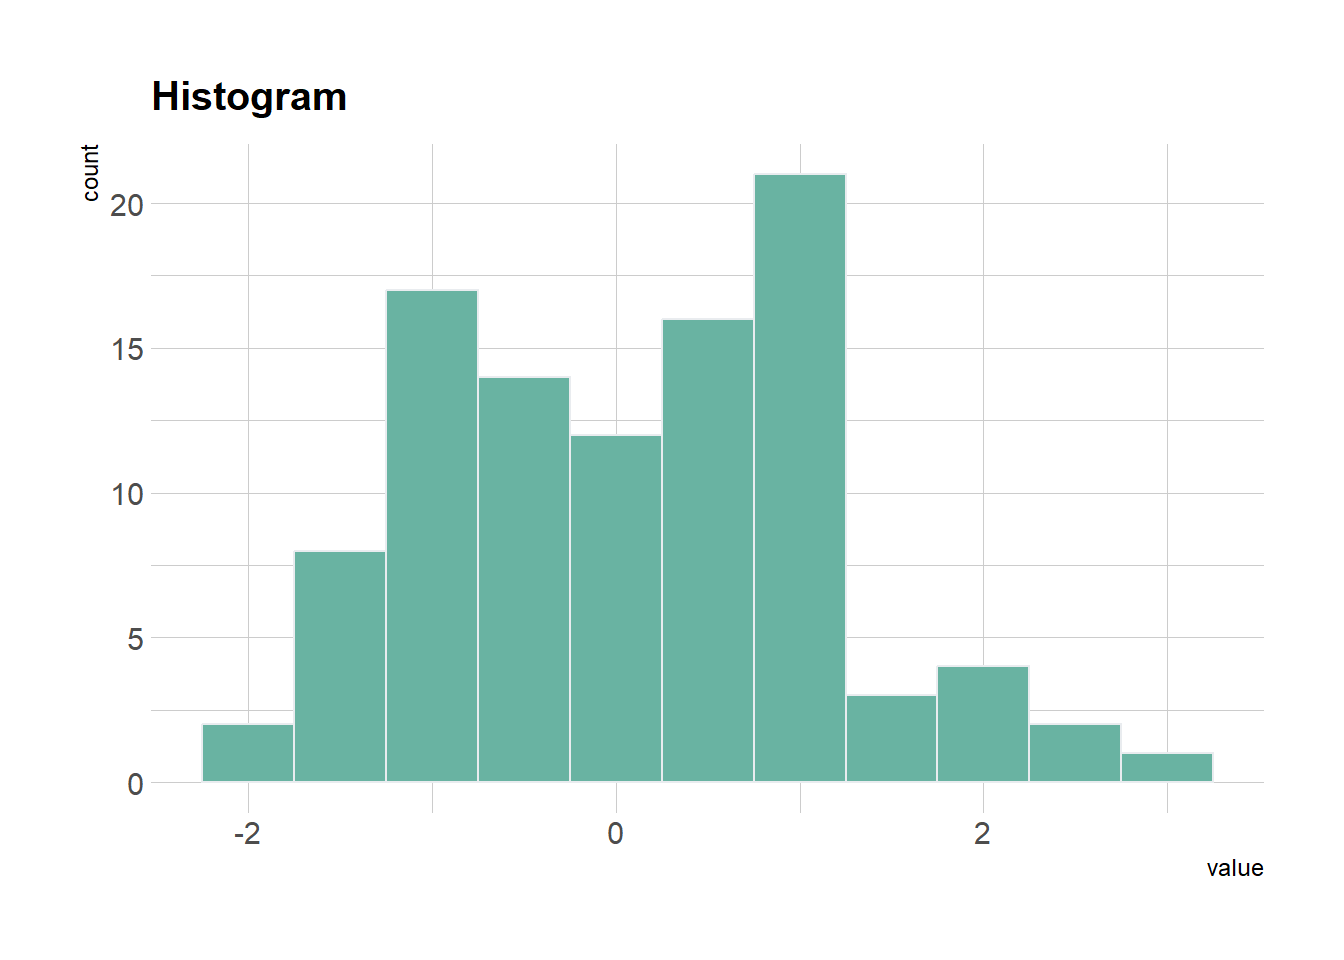
It is relatively straightforward to build a histogram with
ggplot2 thanks to the geom_histogram()
function. Only one numeric variable is needed in the input.
# Libraries
library(ggplot2)
library(hrbrthemes) # library for themes

# Creation of dataset
set.seed(6789)
data = data.frame(value = rnorm(100))

# Basic histogram
ggplot(data, aes(x=value)) +
  geom_histogram(binwidth=.5, fill="#69b3a2", color="#e9ecef") + # vary bin width, colors
  ggtitle("Histogram") +
  theme_ipsum() +
  theme(plot.title = element_text(size=15))