Base R offers many option to customize the chart appearance.
Basically everything is doable with those few options:
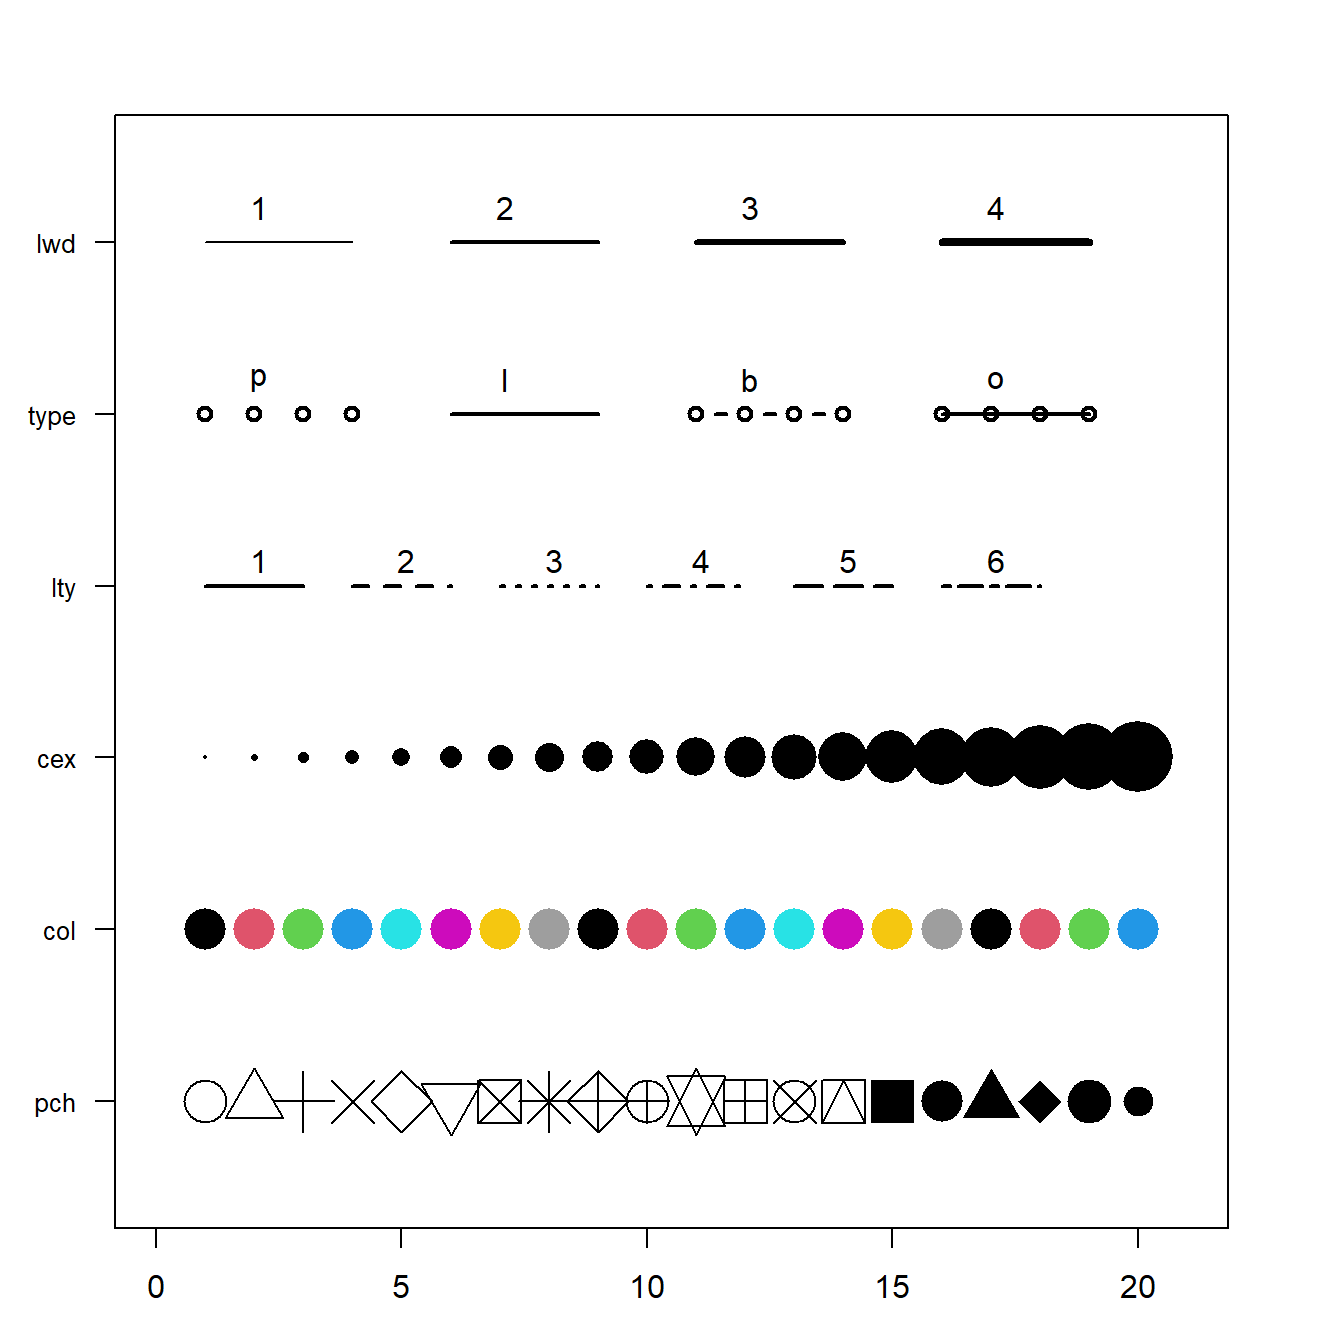
lwd→ line widthtype→ link between dotslty→ line typecex→ shape sizecol→ control colorspch→ marker shape
This post
aims to remind the options offered to customize a graph in base R.
Understand in a sec how to use lwd, type,
lty, cex, pch, and
more.
Base R offers many option to customize the chart appearance.
Basically everything is doable with those few options:
lwd → line widthtype → link between dotslty → line typecex → shape sizecol → control colorspch → marker shape
This document is a work of the statistics team in the Biostatistics and Medical Information Department at Saint-Louis Hospital in Paris (SBIM).
Developed and updated by Noémie Bigot and Anouk Walter-Petrich
noemie.bigot@aphp.fr; anouk.walter-petrich@u-paris.fr
Based on The R Graph Gallery by Yan Holtz.