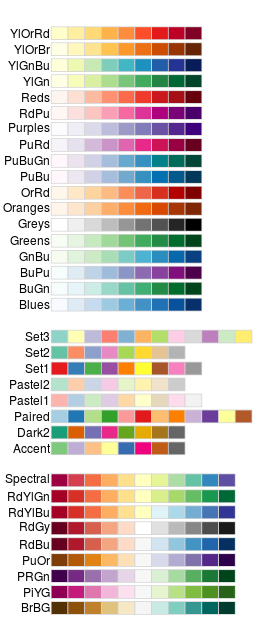
R Color Brewer palettes
Here are few examples of the many R Color Brewer palettes available
and availables themes (package RColorBrewer).
The command
display.brewer.all(colorblindFriendly = TRUE) allow to see
only color blind friendly palettes. The colors of a given palette can be
viewed using the commands
display.brewer.pal(n = 8, name = 'Set2') and
brewer.pal(n = 8, name = "Set2").
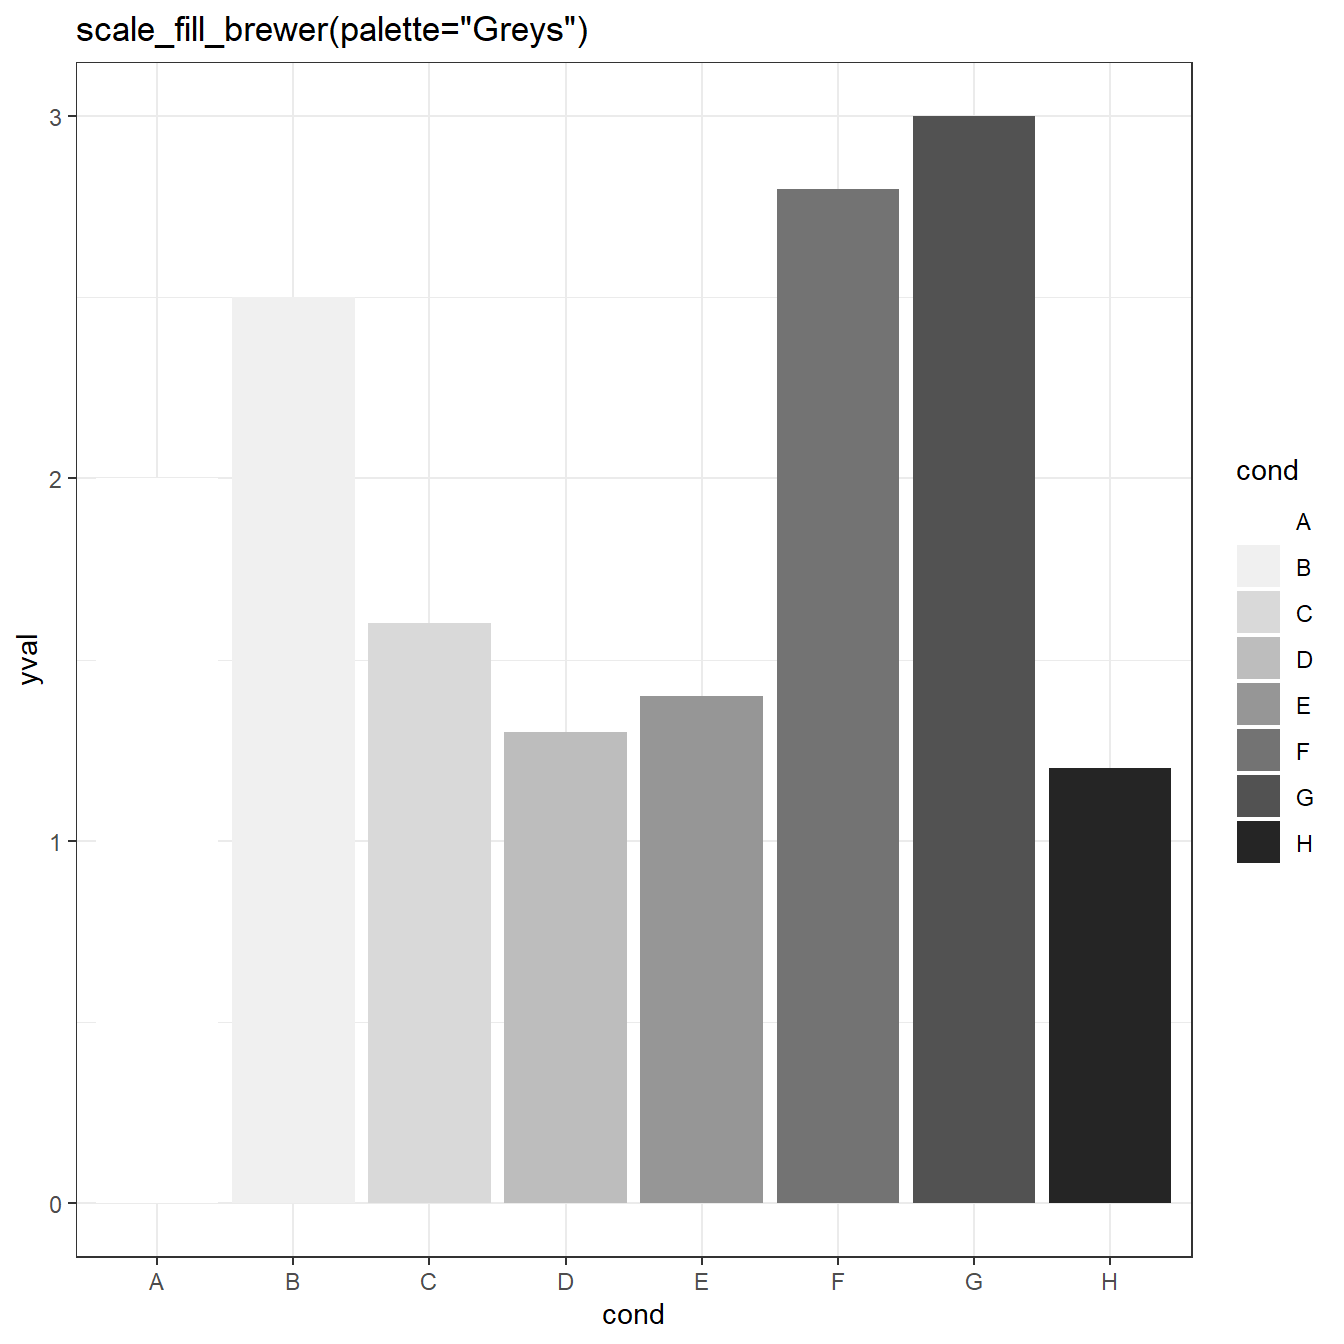
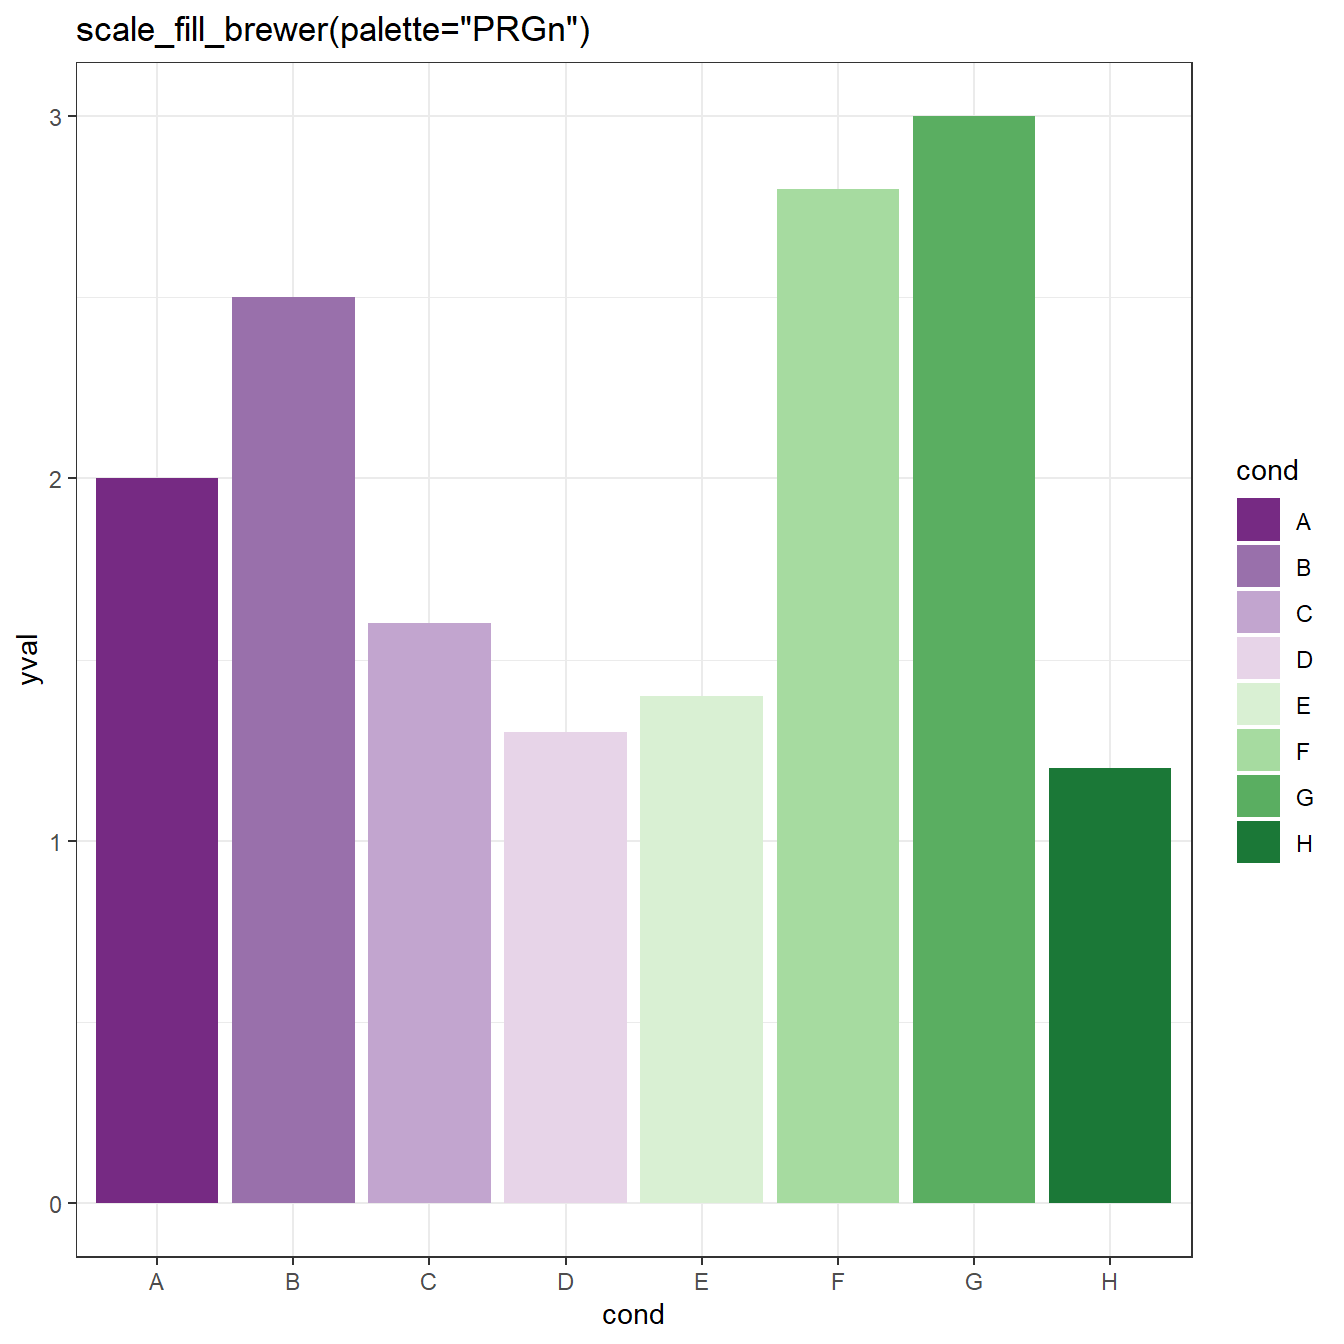
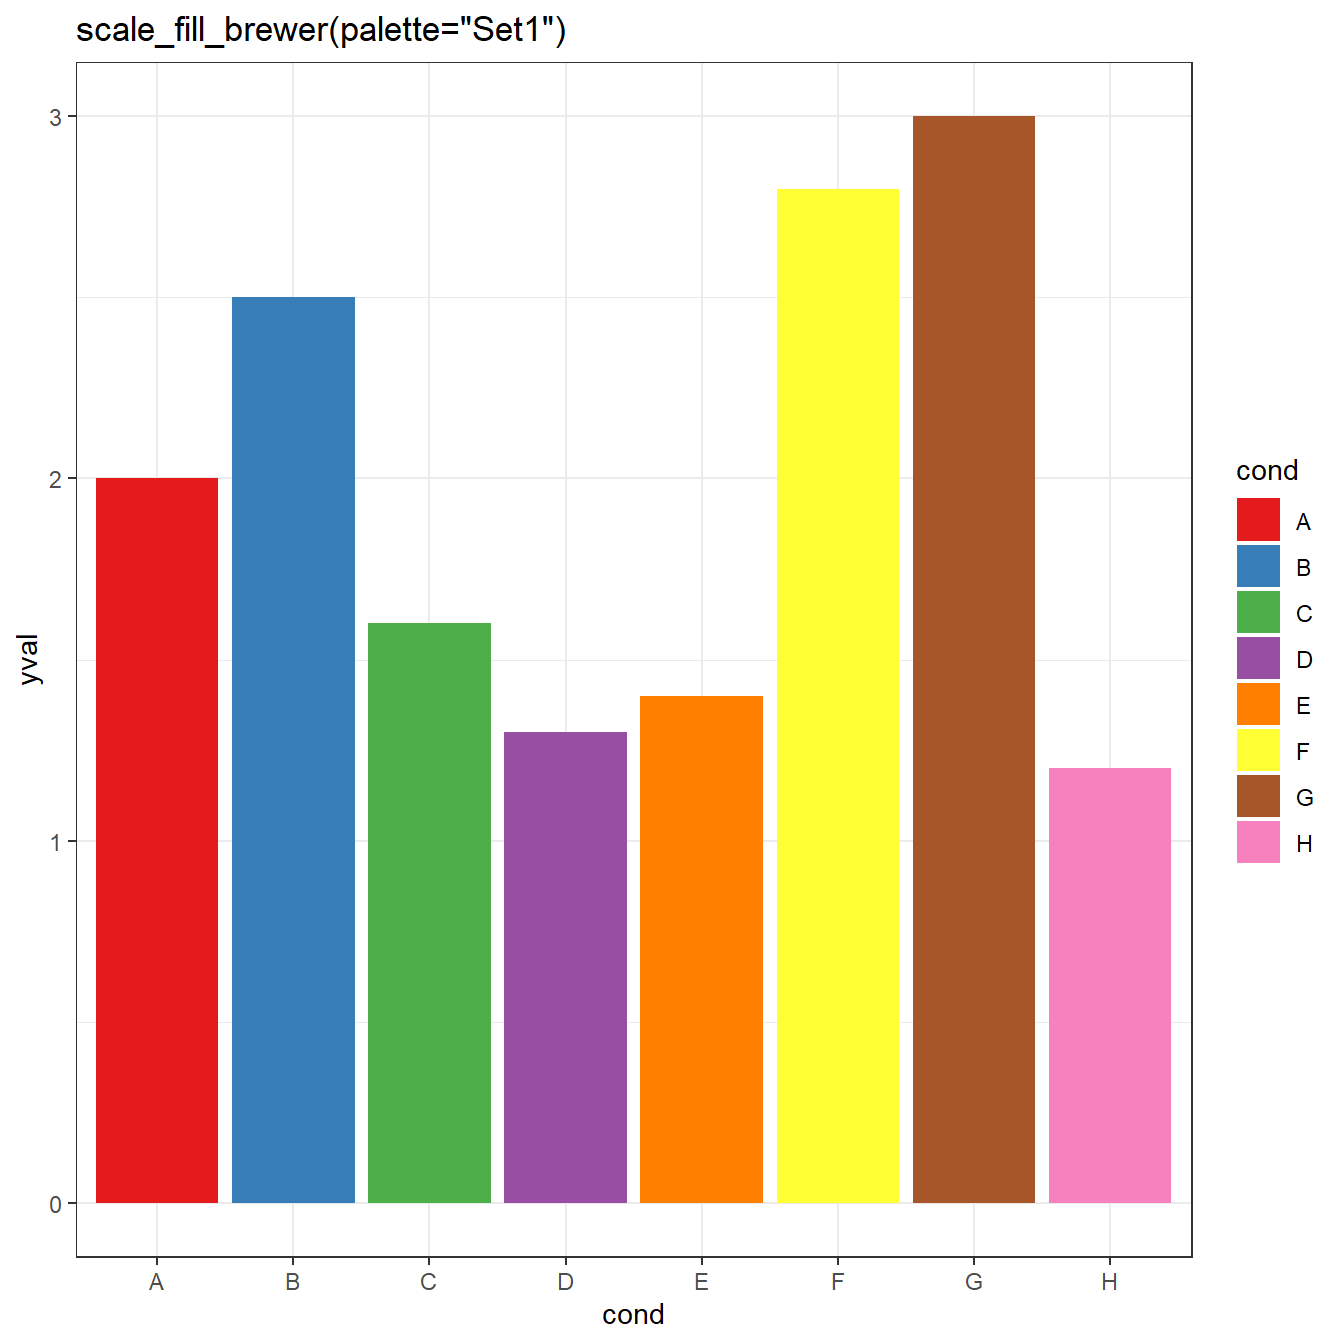
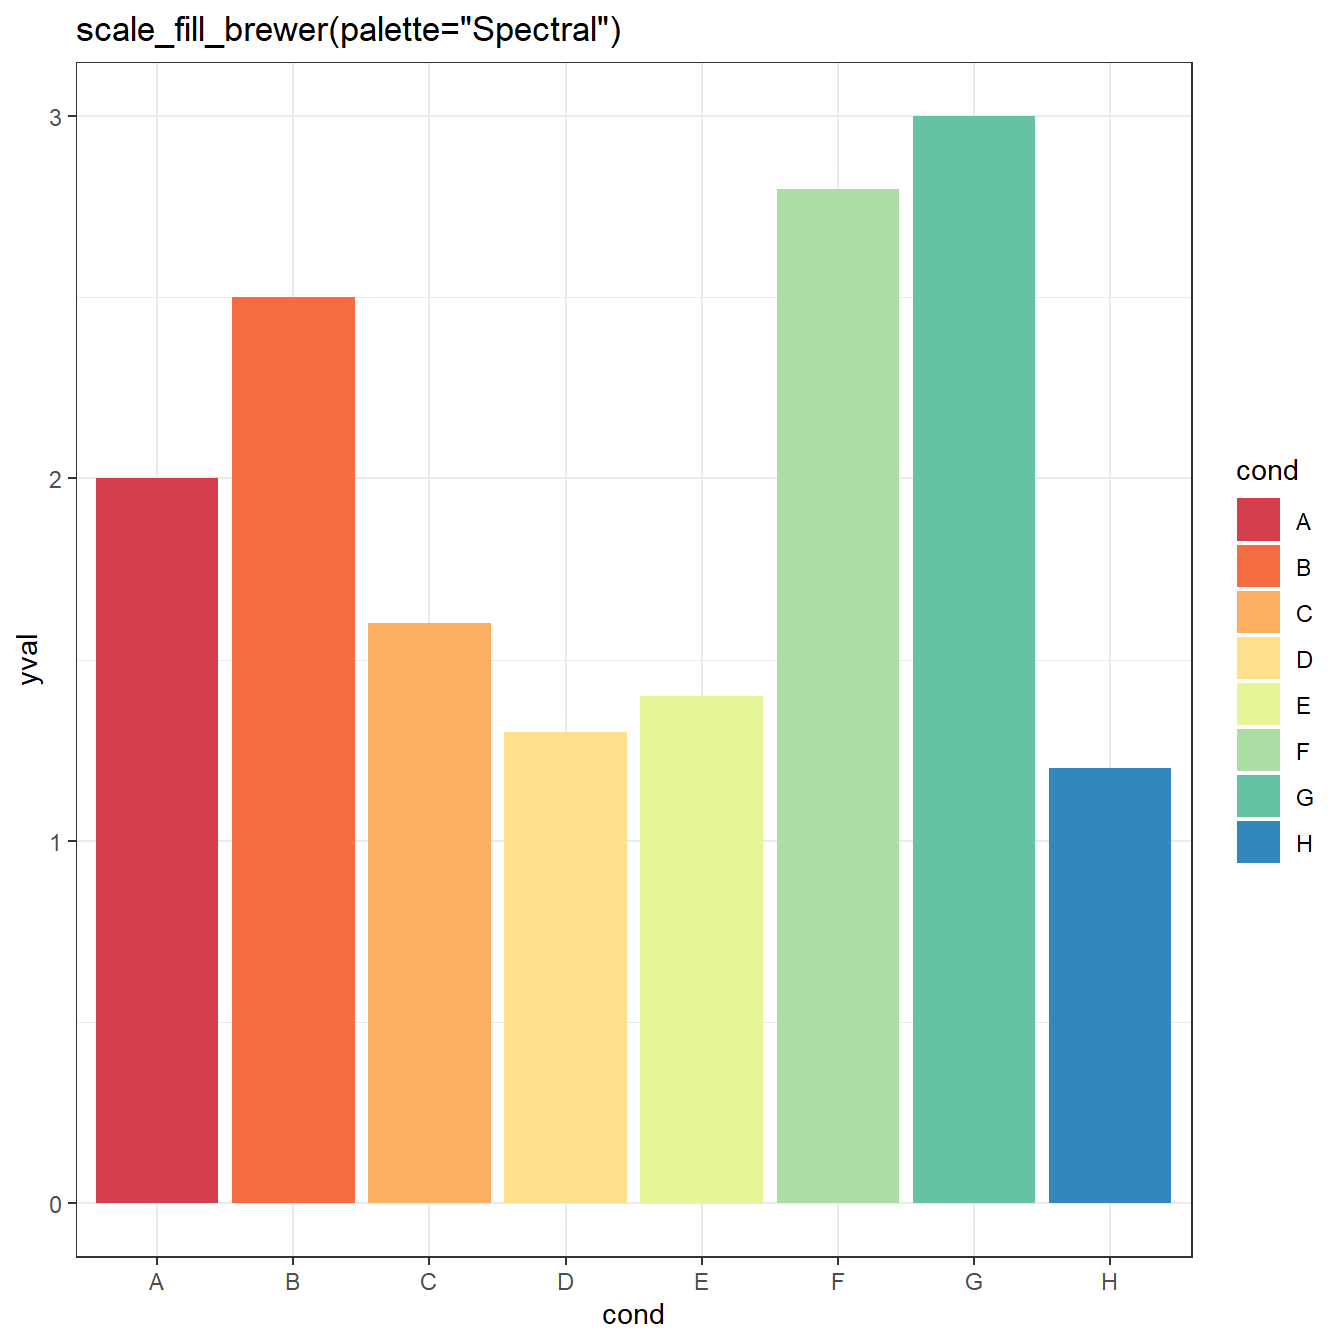
Some examples:
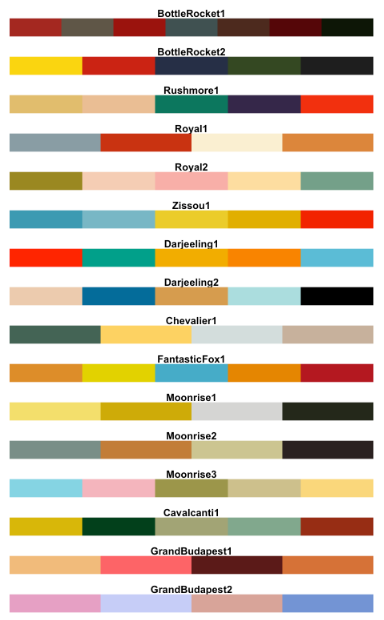
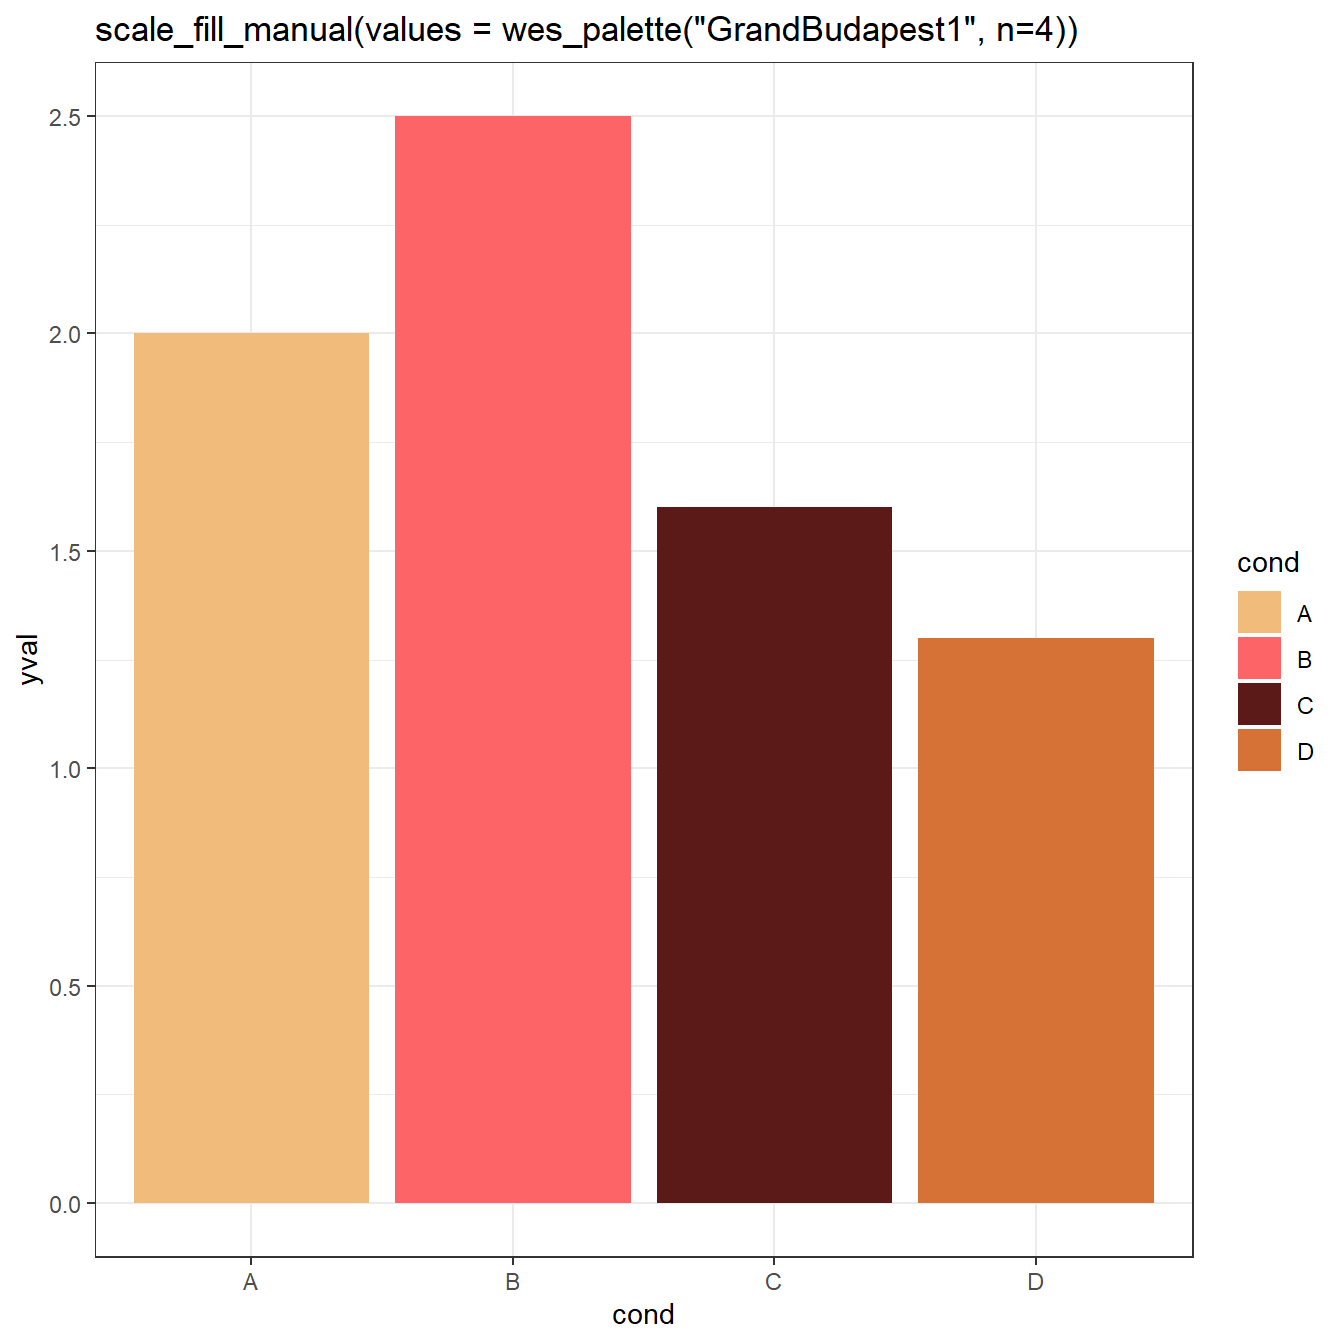
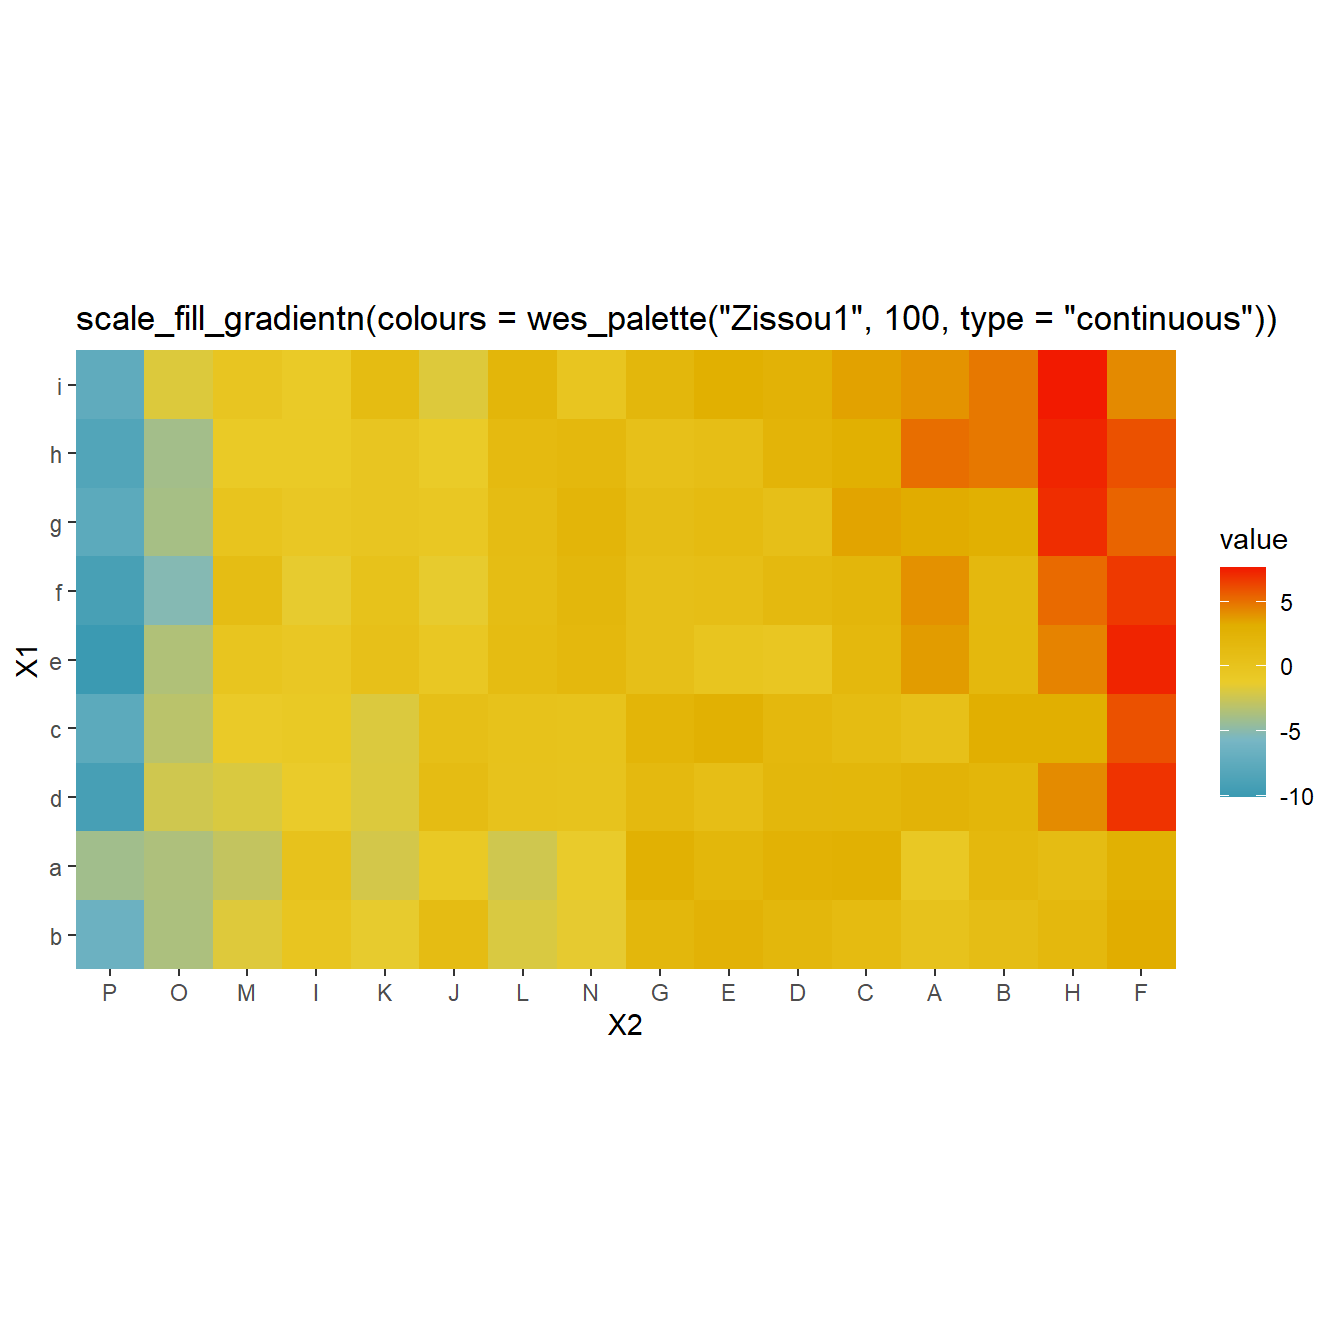
Wes Anderson palettes
Here are few examples of the many Wes Anderson palettes available and
availables themes (package wesanderson).
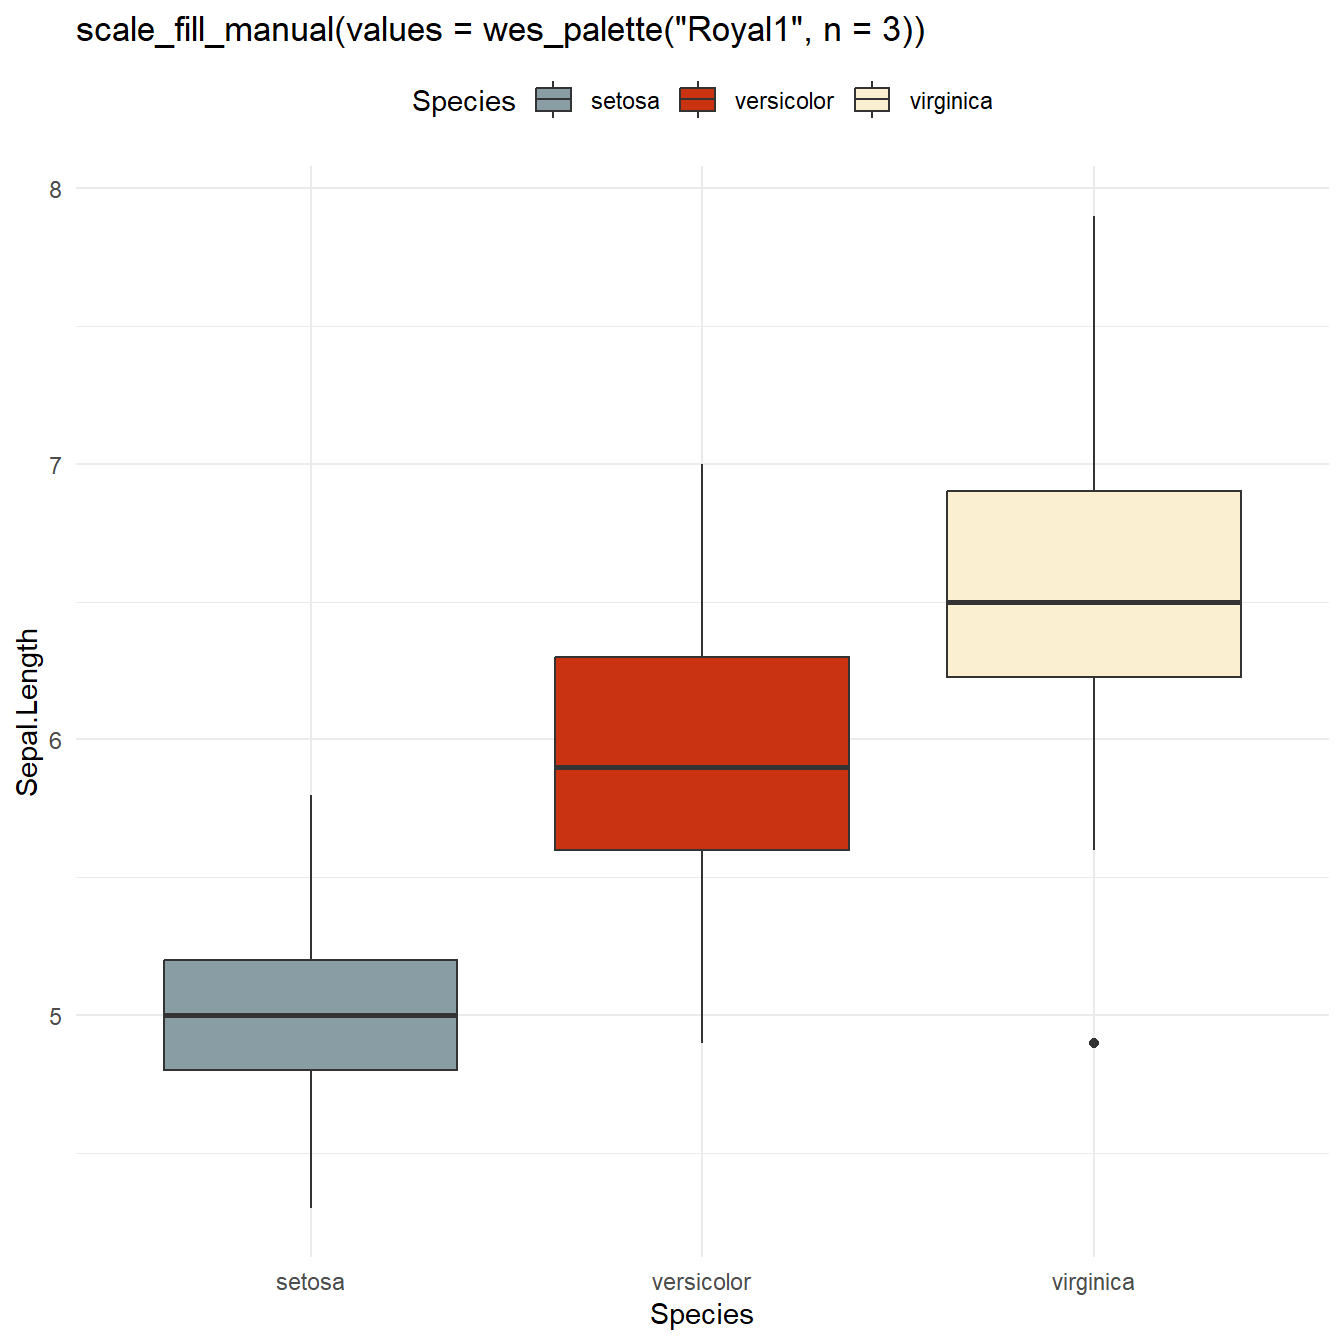
Some examples:
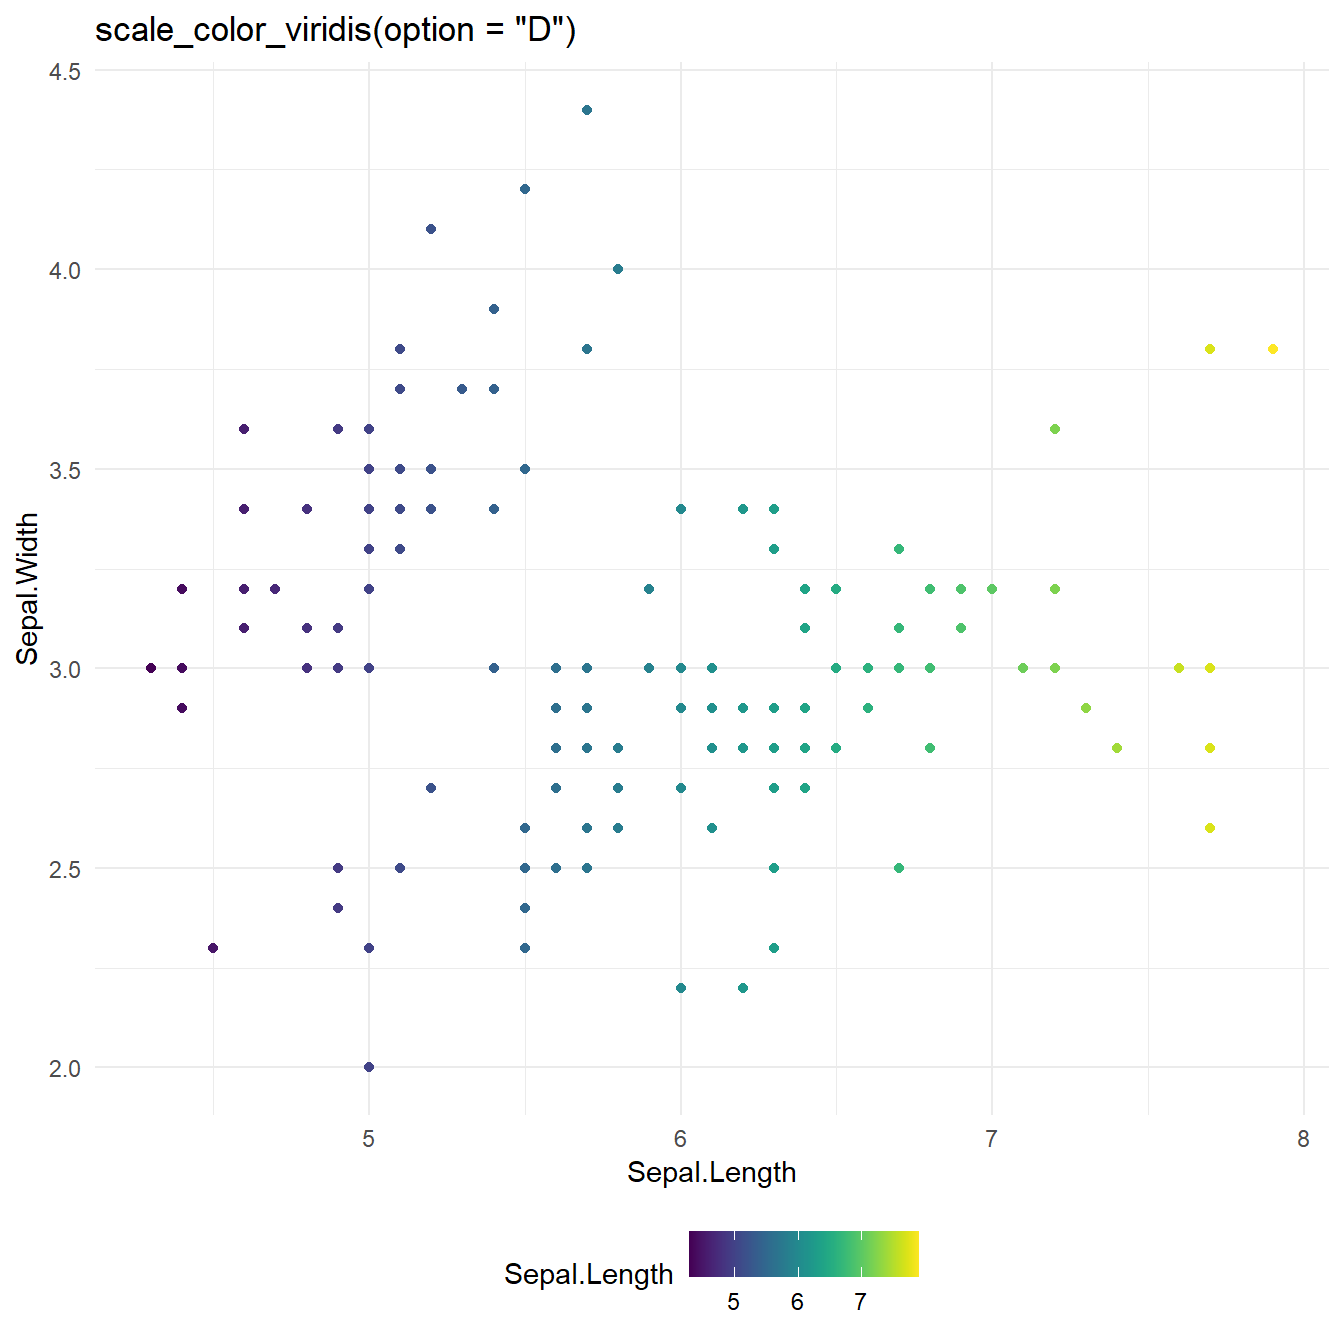
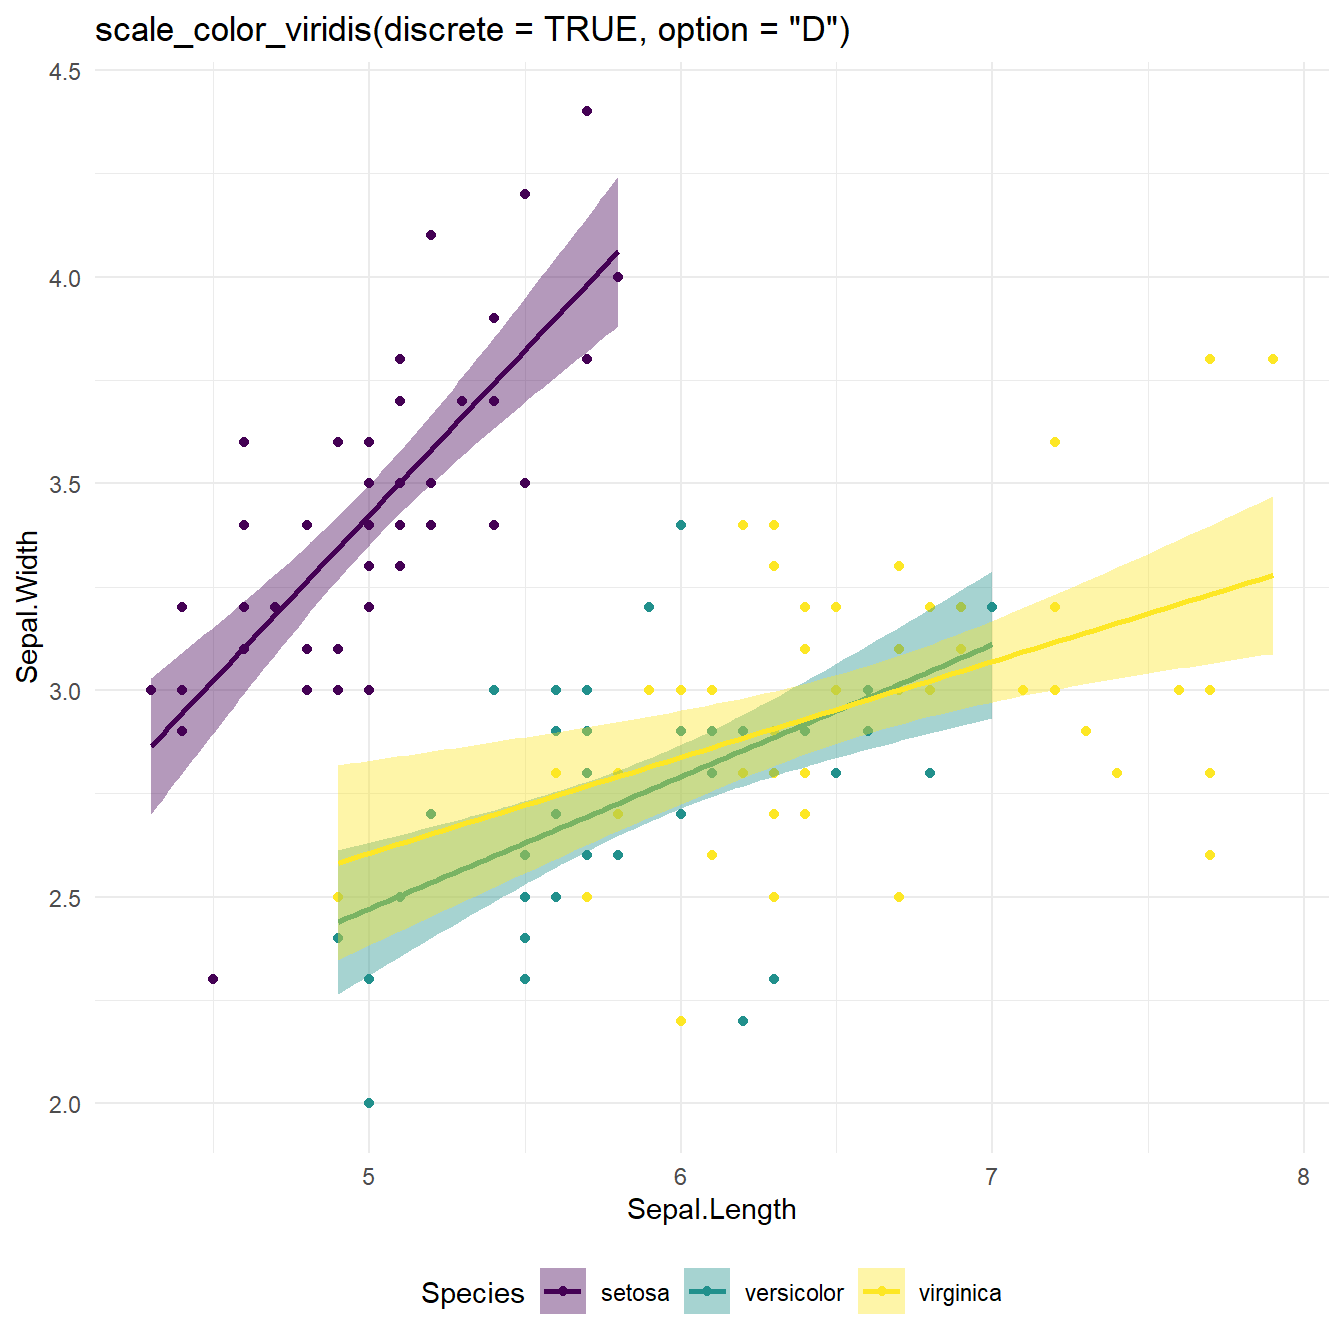
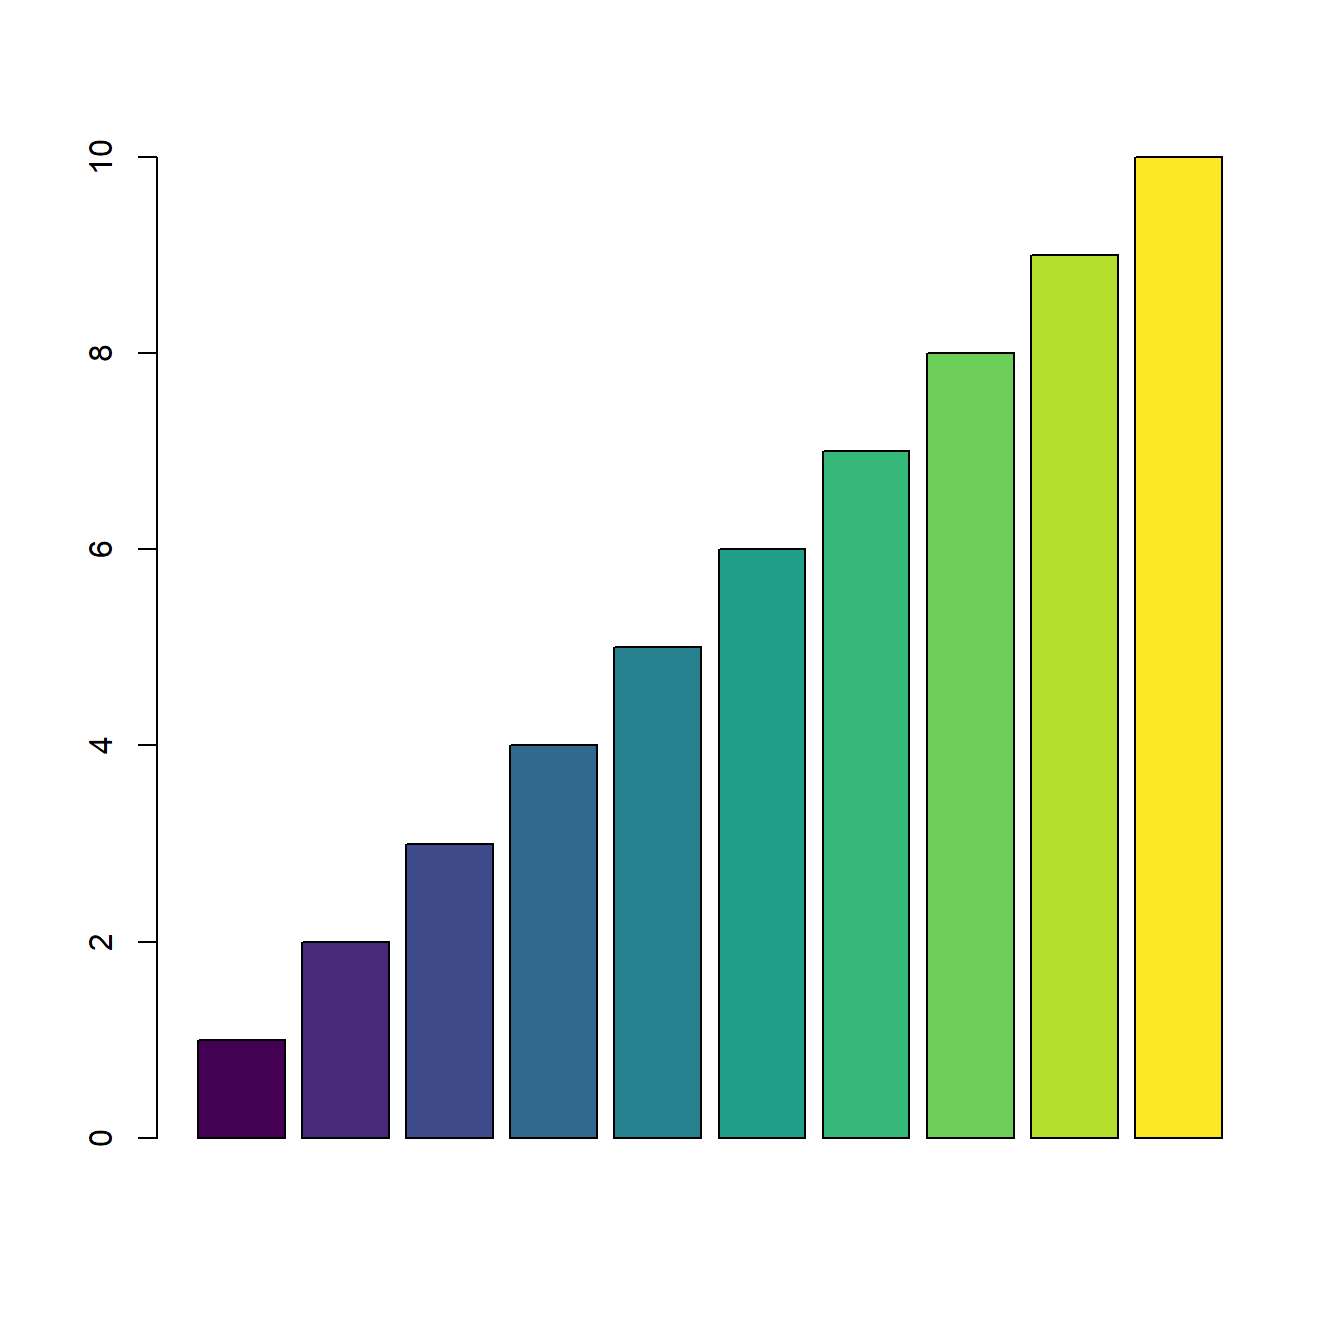
Viridis palettes
Here are few examples of the Viridis palettes available (package
viridis):
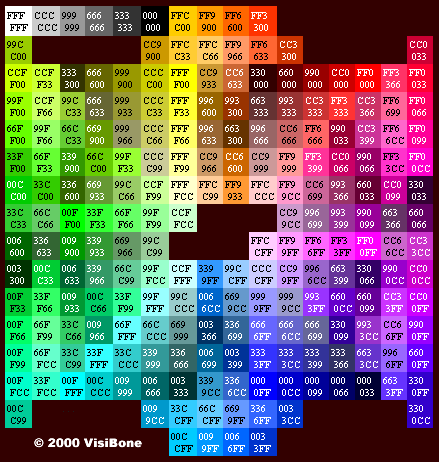
Color by hexadecimal code