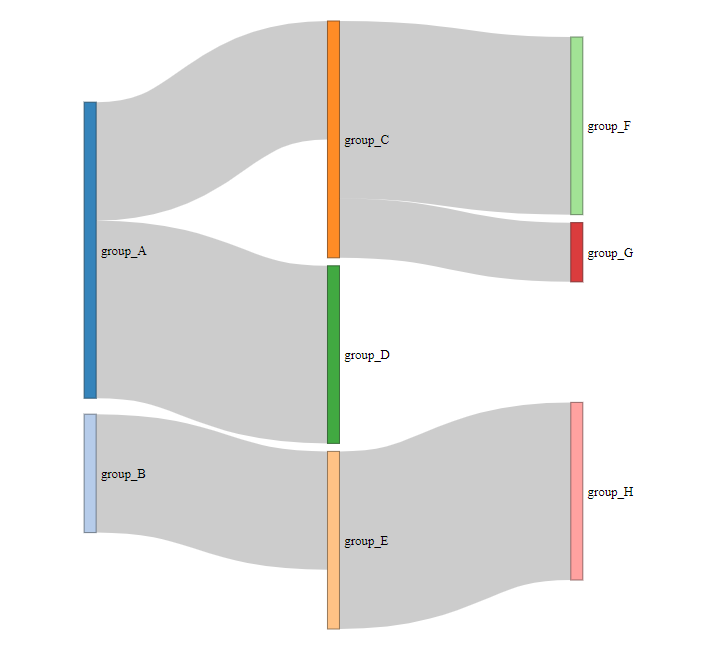
Three Ways to Make Sankey Diagram
A Sankey Diagram is a visualisation technique that allows to display flows. Several entities (nodes) are represented by rectangles or text. Their links are represented with arrow or arcs that have a width proportional to the importance of the flow.