Data & Functions

Different options for swimmer plots
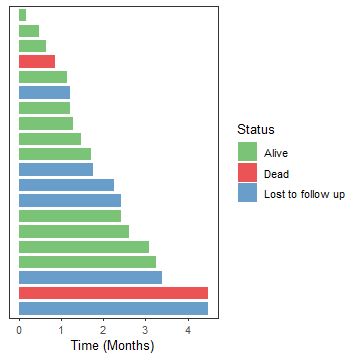
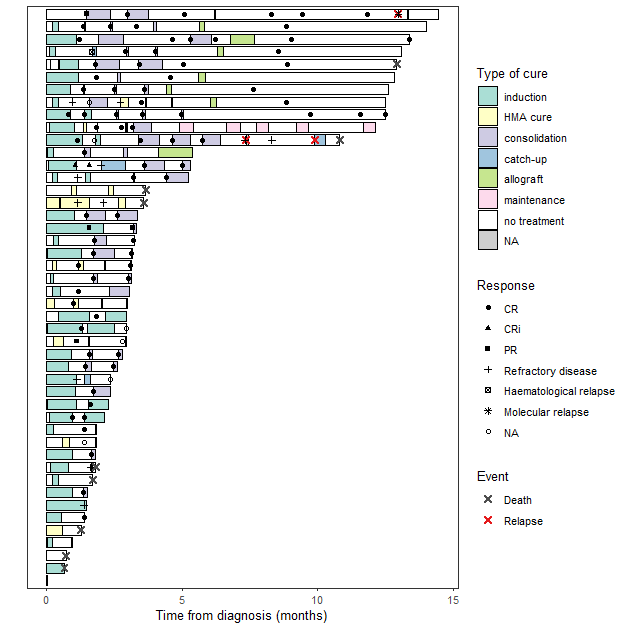
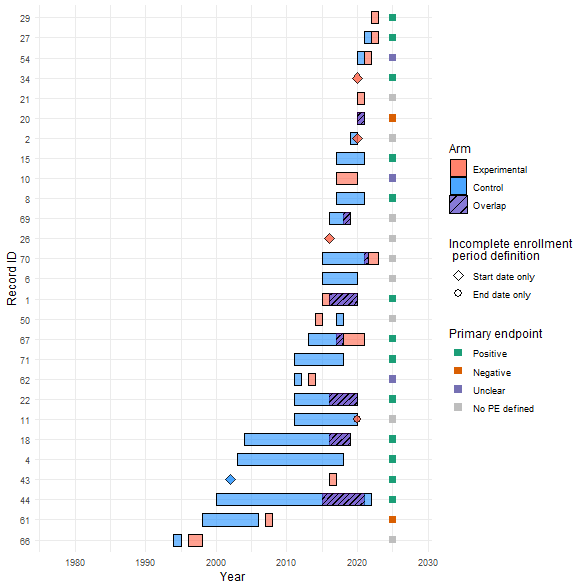
A swimmer plot is a graphical tool used to display individual trajectories over time. It is able to tell a full story using horizontal bars to represent each subject (or study unit), while lines, points and arrows are utilized to display additional information. The swimmer package has a variety of functions which add layers to a swimmer plot by implementing ggplot functions.