A density plot shows the distribution of numeric variable. In ggplot2, the geom-density() function takes care of the kernel density estimation and plot the results. Only one numeric variable is needed as input.
ggplot2
geom-density()
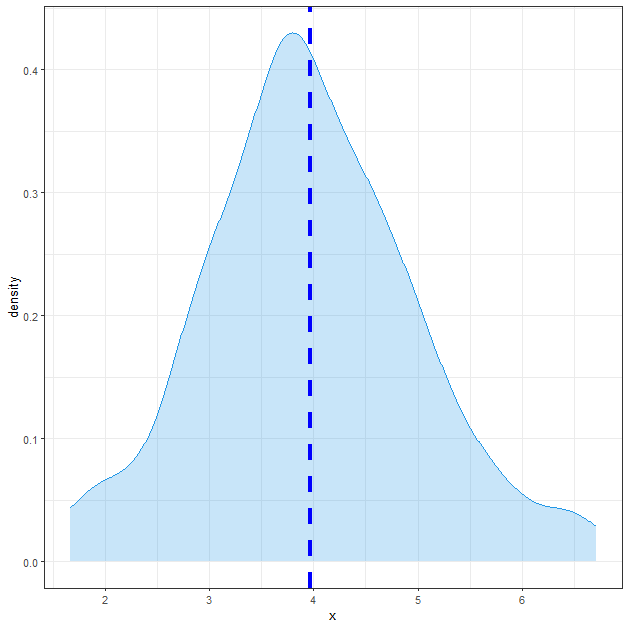
Most basic density curve
Basic density curve
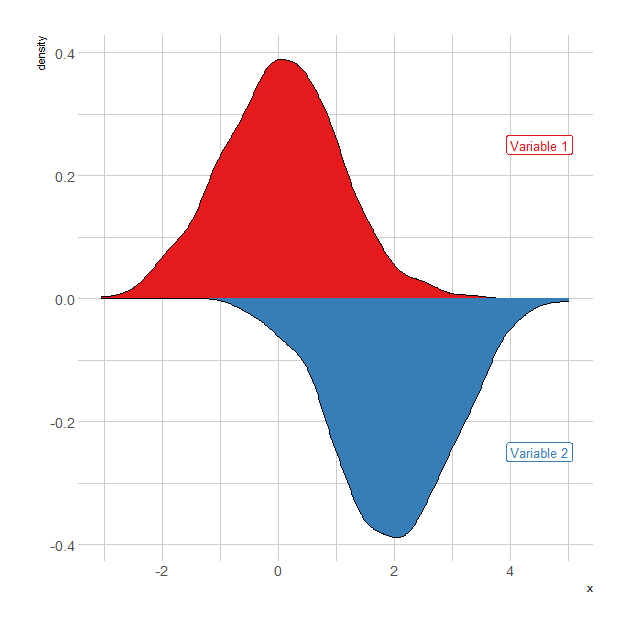
Mirror density curve
Two density curves face to face to compare