Note that geom_ribbon() is used since upper and lower
values of the envelop are available in the input data. As an
alternative, the geom_smooth() function
automatically draw an error envelop using different statistical
models.
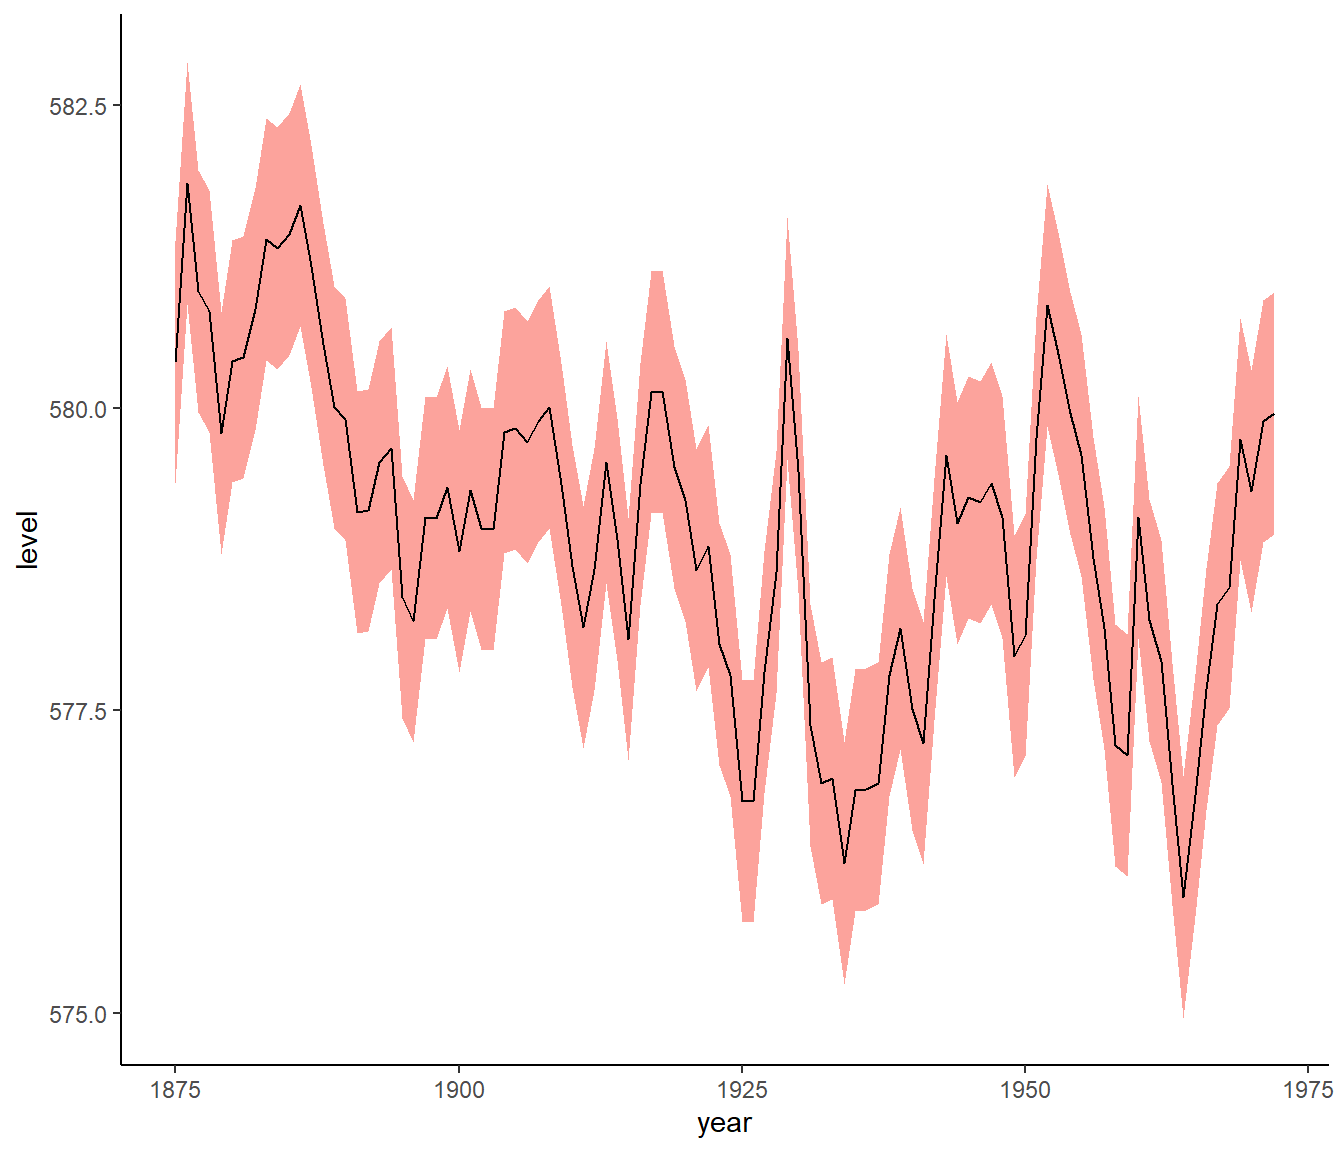
This post
explains how to add an error envelop around a line chart using
ggplot2 and the geom_ribbon()
function.
Note that geom_ribbon() is used since upper and lower
values of the envelop are available in the input data. As an
alternative, the geom_smooth() function
automatically draw an error envelop using different statistical
models.
This document is a work of the statistics team in the Biostatistics and Medical Information Department at Saint-Louis Hospital in Paris (SBIM).
Developed and updated by Noémie Bigot and Anouk Walter-Petrich
noemie.bigot@aphp.fr; anouk.walter-petrich@u-paris.fr
Based on The R Graph Gallery by Yan Holtz.