A histogram is used to study the distribution of one or several numeric variables.
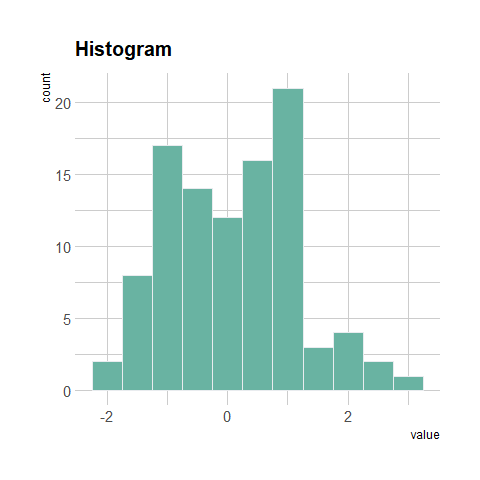
Most basic histogram
Basic histogram
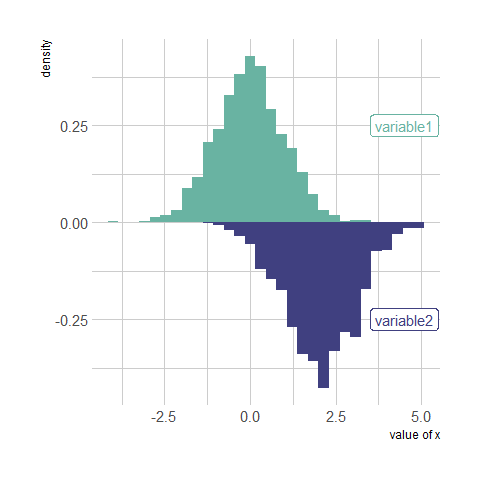
Mirror histogram
Two histograms face to face to compare
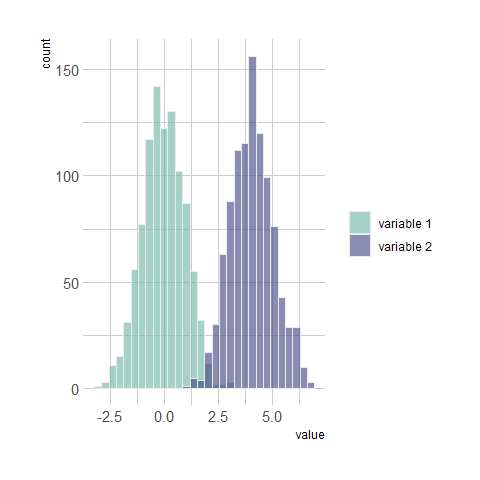
Multi histogram
Several histograms on the same X axis
Histogram with several groups
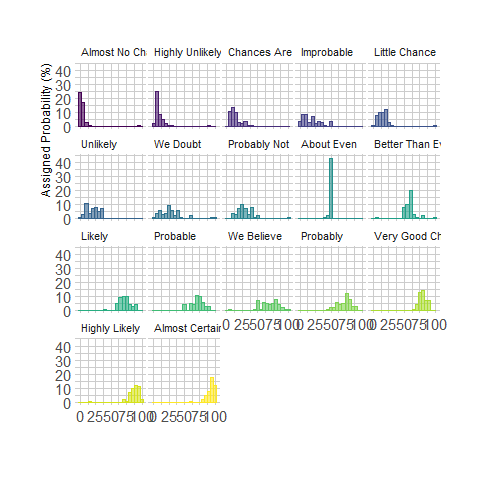
Compare the distribution of many groups with clustering the figure