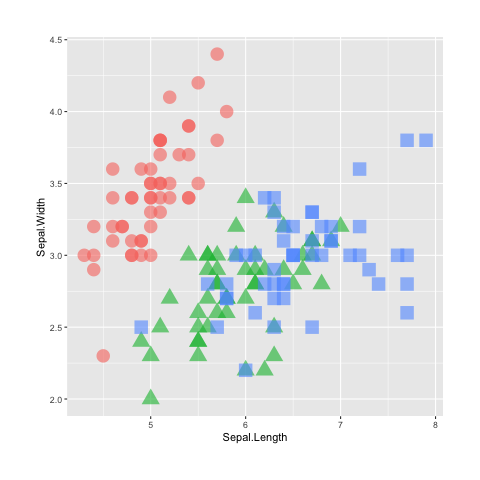
geom_ functions
ggplot2 builds charts through layers using
geom_ functions:
A set of pre-built themes
It is possible to customize any part of a ggplot2 chart
thanks to the theme() function. Here is a glimpse of the
available themes. You can click on one of the themes to get a brief
overview.
plotly turns your plot interactive
Another awesome feature of ggplot2 is its link with the
plotly library. It allows to make interactive charts.
# Libraries
library(ggplot2)
library(plotly)
library(gapminder)

# Interactive plot
p <- gapminder %>%
  filter(year==1977) %>%
  ggplot( aes(gdpPercap, lifeExp, size = pop, color=continent)) +
  geom_point() +
  theme_bw()
ggplotly(p)
